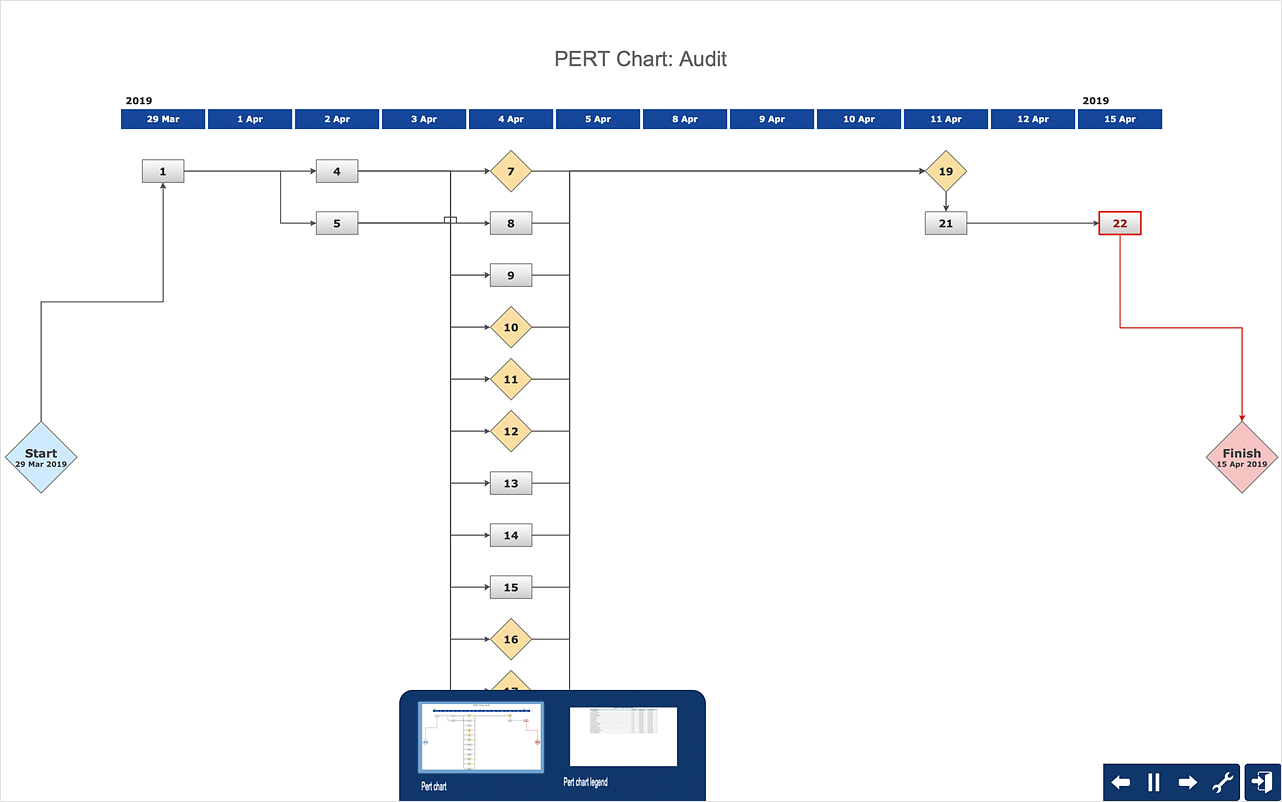
CORRECTIVE ACTIONS PLANNING. PERT Chart
The PERT Chart is constructed as part of the process in creating a schedule of corrective actions. The PERT Chart shows the logical connections and consequence of tasks to be performed. It displays the time period for problem solving and the implementation of all activities through the critical path. ConceptDraw Office suite is a software for corrective actions planning.
Daily Schedule Chart
ConceptDraw DIAGRAM diagramming and vector drawing software extended with Target and Circular Diagrams solution from the Marketing area of ConceptDraw Solution Park is a powerful tool for Daily Schedule Chart design.HelpDesk
How to Create Multiple Projects Schedule on macOS
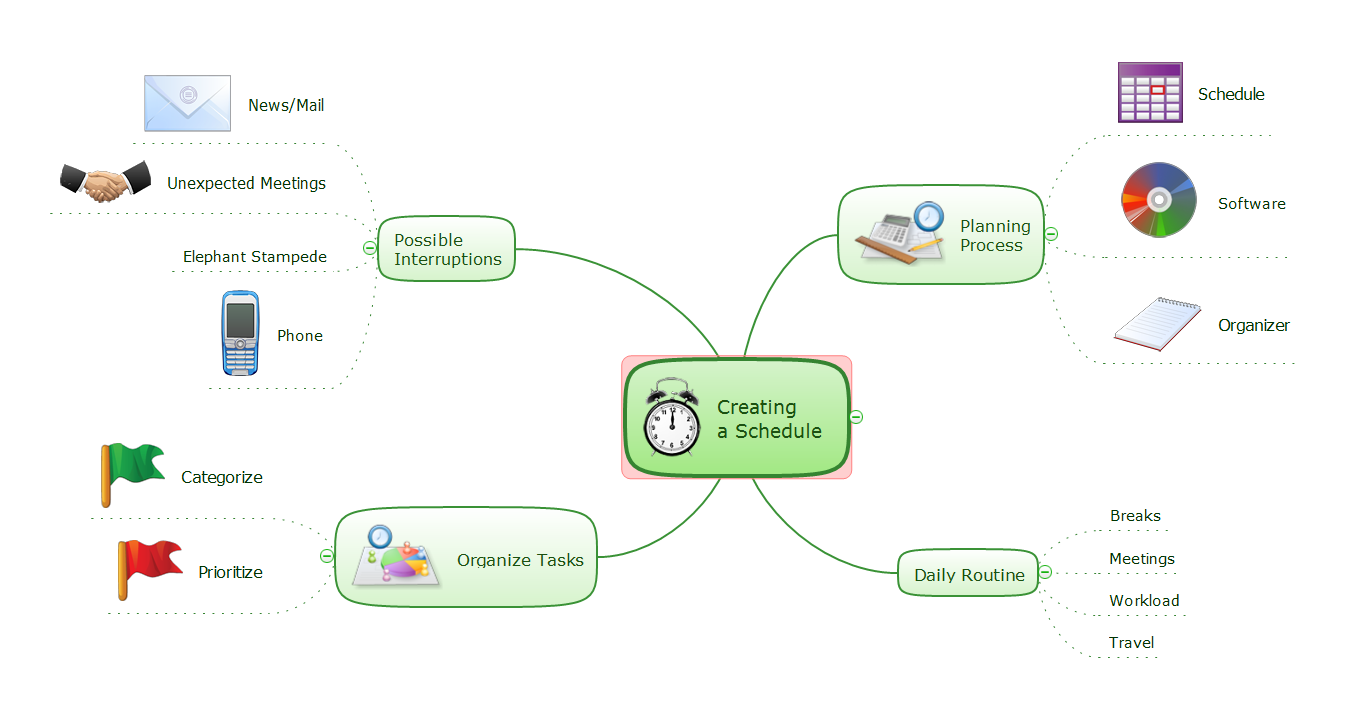
You can create a detailed schedule of your project quickly and easy with ConceptDraw PROJECT. It is easy to use the Multiproject Dashboard to plan multiple projects as if were a single one.Creating a Schedule
The preparation of detailed schedule is a good assistant on the way to successful solving various problems and implementation the projects of any complexity. At the same time, often the scheduling is quite not an easy task, which requires a lot of time and efforts. However, the use of specialized software such as ConceptDraw MINDMAP can greatly facilitate its implementation. This software provides large set of powerful tools allowing you to create successful plan that helps to break the task into the subtasks, to make detailed work breakdown structure, to arrange clearly all actions, to present them visually on the plan and to calculate the required resources for implementation defined steps and actions. ConceptDraw MINDMAP software from ConceptDraw Office suite is a perfect application for creating a schedule of any event or process, it offers all needed drawing tools and the predesigned templates for easy planning processes, for scheduling the daily routine, organizing different tasks and possible interruptions.HelpDesk
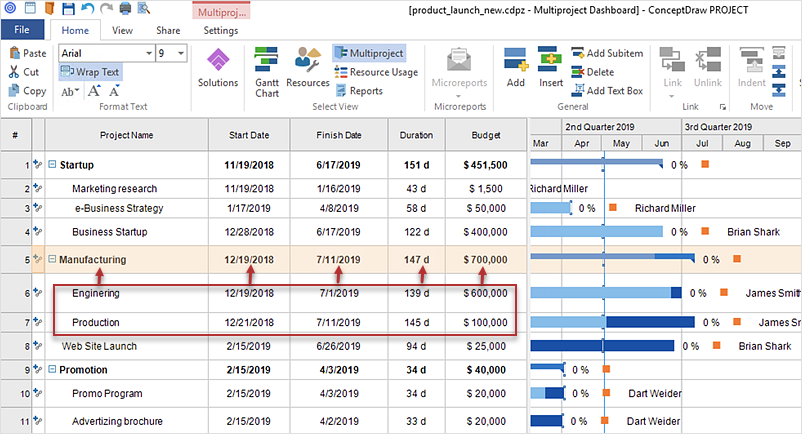
How to Create Multple Projects Schedule on Windows
ConceptDraw PROJECT is simple project scheduling software, it allows grouping individual projects into multiple projects that can use a common resource pool and a synchronized task schedule. You can create a detailed schedule of your multiple projects quickly and easy with ConceptDraw PROJECT. When considering project change requests, a project manager can model their interaction by grouping or dividing into sub-projects. It includes useful critical path scheduling software tools. The Multiproject Dashboard mode enables planning and managing several projects simultaneously using the single resource pool for all projects. The Multiproject Dashboard mode helps you plan multiple projects while providing you with the overall view.HelpDesk
How to Operate with Project Time Frames in ConceptDraw PROJECT
ConceptDraw PROJECT applies an advanced scheduling facilities to enable you arrange your project's tasks with existing human and material resources. Comprehension of project scheduling principle allows you to plan the project the best way to execute it. Sometimes user is wondering why the task is moved to a different time than he supposed. Or he may be confused when a task's tardiness provoke the unwanted shift of other tasks. This article describes how do changes to the Start/Finish dates, or the Duration of the task affect the project schedule, created in ConceptDraw PROJECT.Activity Network (PERT) Chart
Activity Network and Project Evaluation and Review Technique, or PERT, charts are a way of documenting and analyzing the tasks in a project. This diagram is constructed as part of the process in creating a schedule of corrective actions. The Activity Network Chart (PERT) shows the logical connections and consequence of tasks to be performed. It displays the time period for problem solving and the implementation of all activities through the critical path.Pyramid Diagram
The Project Management Triangle Diagram depicts three main constraints of any project: scope, time and cost. Projects have to comply with the specified scope, projects should be finished in time and projects need to consume the budget. Each of the constraints represents one side of the triangle, and any change in budget or timing or scope affects the entire diagram. This diagram was made using ConceptDraw Office suite including best marketing project management software extended with collection of tools for creative project management software and project management reporting software symbols.HelpDesk
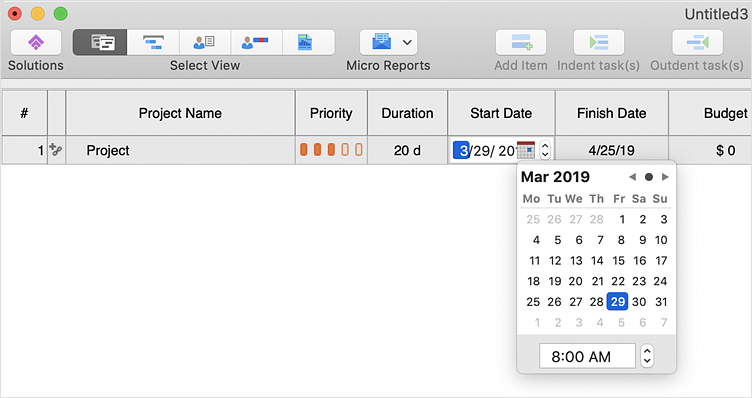
How to Shift Dates in ConceptDraw PROJECT
A way to shift all dates in a project a specified period, so you can use old project schedules as a template for new schedulesHelpDesk
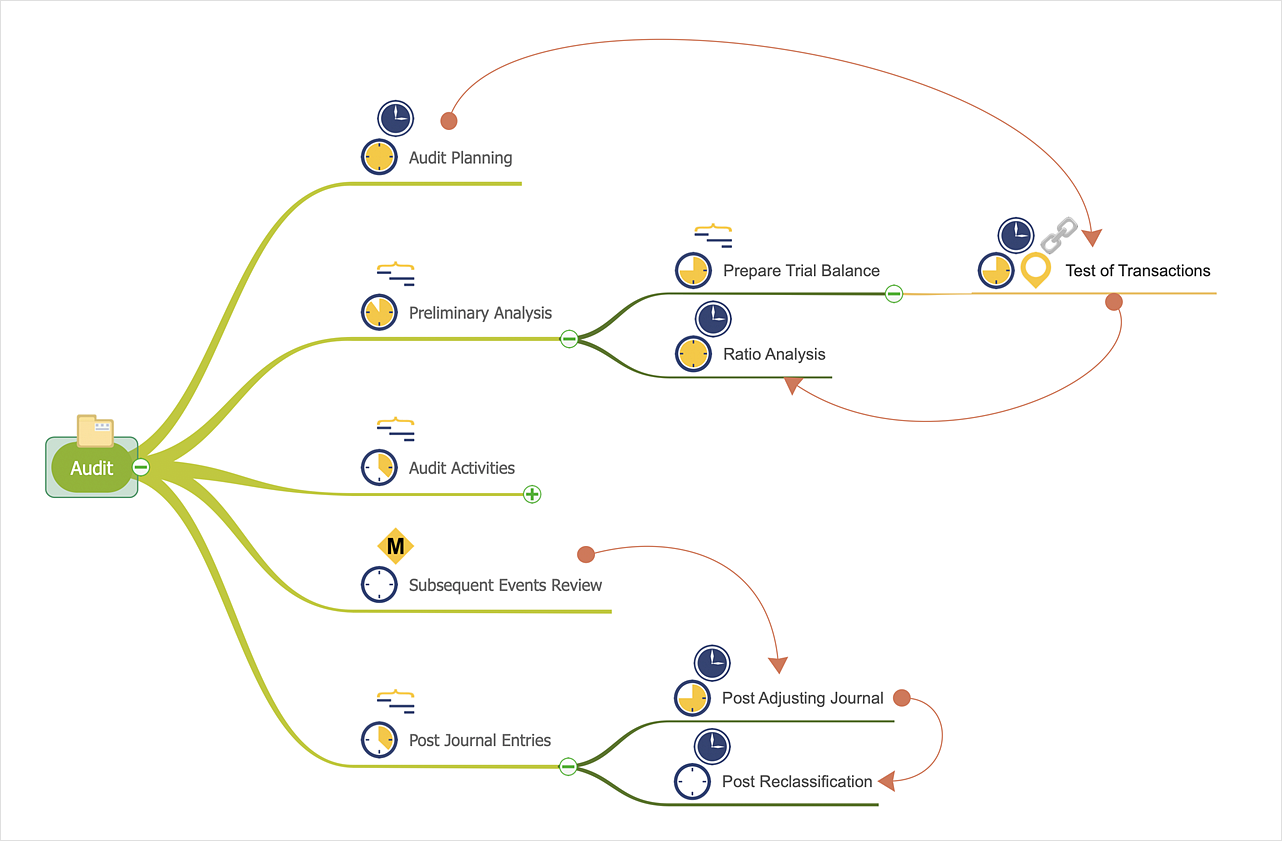
How to Make a Mind Map from a Project Gantt Chart
ConceptDraw Office allows you to see the project data from ConceptDraw PROJECT in a mind map structure by opening your project in ConceptDraw MINDMAP.HelpDesk
How To Create a PERT Chart Using PM Easy Solution
Project Evaluation and Review Technique (PERT) is a method of project tasks evaluation and analysis. PERT - is a method of analyzing the tasks required to complete the project. It includes analysis of the time required to complete each task, as well as the determination of the time required to carry out the whole project. PERT was developed to facilitate the planning of huge and complex projects. PERT is used for very large, complex, and non-standard projects. Technology implies the presence of uncertainty, making it possible to develop a schedule of the project without a precise information on details and time required for all of its components. The most popular part of PERT is a method of the critical path, based on the construction of the network schedule (PERT network diagram). ConceptDraw Office delivers you the best way to create PERT chart for your project using compatibility between ConceptDraw PROJECT and ConceptDraw DIAGRAM.Business diagrams & Org Charts with ConceptDraw DIAGRAM
The business diagrams are in great demand, they describe the business processes, business tasks and activities which are executed to achieve specific organizational and business goals, increase productivity, reduce costs and errors. They let research and better understand the business processes. ConceptDraw DIAGRAM is a powerful professional cross-platform business graphics and business flowcharting tool which contains hundreds of built-in collections of task-specific vector stencils and templates. They will help you to visualize and structure information, create various Business flowcharts, maps and diagrams with minimal efforts, and add them to your documents and presentations to make them successful. Among them are Data flow diagrams, Organization charts, Business process workflow diagrams, Audit flowcharts, Cause and Effect diagrams, IDEF business process diagrams, Cross-functional flowcharts, PERT charts, Timeline diagrams, Calendars, Marketing diagrams, Pyramids, Target diagrams, Venn diagrams, Comparison charts, Analysis charts, Dashboards, and many more. Being a cross-platform application, ConceptDraw DIAGRAM is very secure, handy, free of bloatware and one of the best alternatives to Visio for Mac users.
HelpDesk
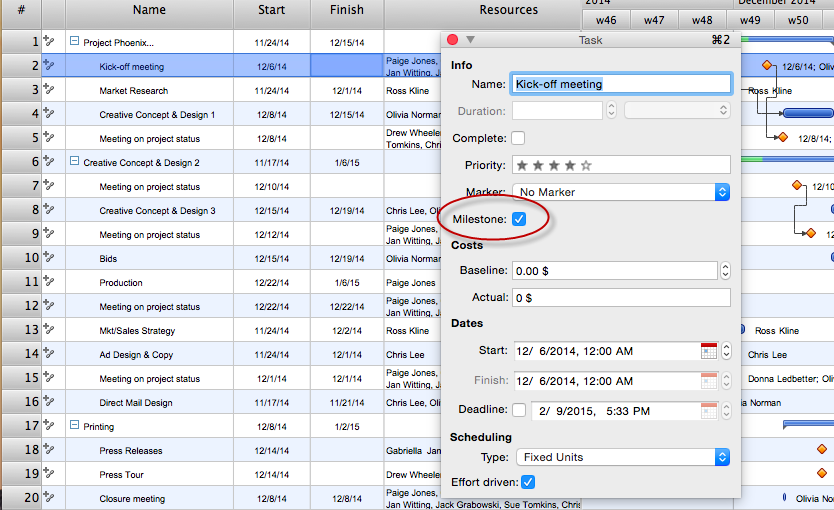
How to Identify Project Milestones
In ConceptDraw PROJECT you can easily turn any task from a project schedule into a milestone. Here are some tips on how to set milestones in a project file.Target Diagram
Target Diagram is a convenient and visual way of presentation information which is popular and widely used in marketing, business and economics. ConceptDraw DIAGRAM diagramming and vector drawing software extended with Target and Circular Diagrams solution from the Marketing area of ConceptDraw Solution Park is ideal for fast and easy drawing a Target Diagram.
 Management
This solution extends ConceptDraw DIAGRAM and ConceptDraw MINDMAP with Management Diagrams and Mind Maps (decision making, scheduling, thinking ideas, problem solving, business planning, company organizing, SWOT analysis, preparing and holding meetings
- Examples Of Business Schedules
- Schedule pie chart - Daily action plan | Business Diagram Software ...
- Business Proposal Project Schedule
- Sample Of Schedule For Business
- Create Response Charts | Business Diagram Software | PM ...
- Timeline diagram - Project schedule | Project timeline diagram ...
- Business Productivity - Marketing | Target Diagram | Daily Schedule ...
- Schedule pie chart - Daily action plan | Social Media Flowchart ...
- Schedule pie chart - Daily action plan | Pie Chart | Business Report ...
- Daily Schedule Chart | Target Diagram | Business Productivity ...
- Project timeline diagram - New business project plan | Timeline ...
- Daily Schedule Chart | Downloading the Old Versions of ...
- Gym Layout | Business Process Diagrams | Gym and Spa Area ...
- Blank Calendar Template | Business Calendar | Schedule pie chart ...
- Business Swot Analysis Schedule Template And Pdf Examples
- Draw Schedule Template
- Process Flow Diagram Schedule Update
- Schedule pie chart - Daily action plan | Target and Circular ...
- Schedule pie chart - Daily action plan | Basic Flowchart Symbols ...


