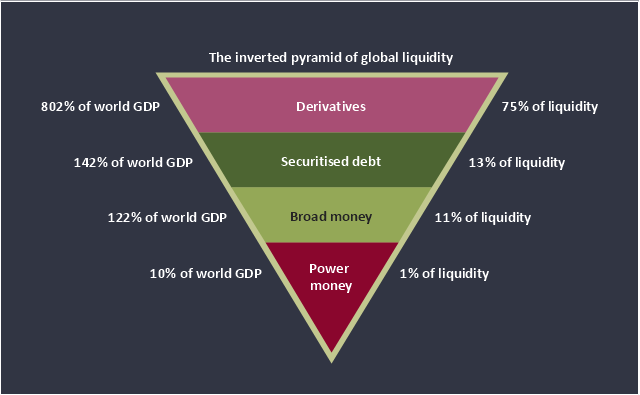
This inverted pyramid diagram of global liquidity shows world GDP and liquidity for 4 levels: derivatives, securitised debt, broad money, and power money.
"In business, economics or investment, market liquidity is a market's ability to facilitate an asset being sold quickly without having to reduce its price very much (or even at all). Equivalently, an asset's market liquidity (or simply "an asset's liquidity") is the asset's ability to sell quickly without having to reduce its price very much. Liquidity is about how big the trade-off is between the speed of the sale and the price it can be sold for. In a liquid market, the trade-off is mild: selling quickly will not reduce the price much. In a relatively illiquid market, selling it quickly will require cutting its price by some amount.
Money, or cash, is the most liquid asset, because it can be "sold" for goods and services instantly with no loss of value. There is no wait for a suitable buyer of the cash. There is no trade-off between speed and value. It can be used immediately to perform economic actions like buying, selling, or paying debt, meeting immediate wants and needs.
If an asset is moderately (or very) liquid, it has moderate (or high) liquidity. In an alternative definition, liquidity can mean the amount of highly liquid assets. If a business has moderate liquidity, it has a moderate amount of very liquid assets. If a business has sufficient liquidity, it has a sufficient amount of very liquid assets and the ability to meet its payment obligations." [Market liquidity. Wikipedia]
This inverted triangle diagram was redesigned using the ConceptDraw PRO diagramming and vector drawing software from Wikimedia Commons file The inverted pyramid of global liquidity.gif. [commons.wikimedia.org/ wiki/ File:The_ inverted_ pyramid_ of_ global_ liquidity.gif]
This triangular chart example is included in the Pyramid Diagrams solution from the Marketing area of ConceptDraw Solution Park.
Purchase Process Flow Chart, Receiving Process Flow Chart, Accounting Flowchart Example.
The purchasing process follows very specific guidelines and includes a purchasing cycle flowchart and receiving process flow chart. Common key elements of purchasing process.It is important to know how purchasing processes work and how each operation is done.
- Cisco WAN - Vector stencils library | Design elements - Cisco WAN ...
- Design elements - Switches and relays | Electrical Diagram Symbols ...
- Cisco WAN - Vector stencils library | Design elements - Cisco WAN ...
- What is Cloud Computing | Cloud Computing | Design elements ...
- Home area network wiring diagram | Design elements - Cisco WAN ...
- Personal area (PAN) networks. Computer and Network Examples ...
- Design elements - Cisco WAN | Computer Network Diagrams ...
- Cisco WAN - Vector stencils library | Cisco Design | Tree Network ...
- Think and act effectively | Percent of students achieved a 36 on ACT ...
- Telecom equipment - Vector stencils library | Telecommunication ...
- Basic Flowchart Symbols and Meaning | Design elements - Fire and ...
- Design elements - Switches
- Sales Process Flowchart. Flowchart Examples | Global liquidity ...
- Electrical Drawing Software | Circuits and Logic Diagram Software ...
- Cloud Computing Architecture Diagrams | Cloud round icons ...
- Pyramid Diagram | Global liquidity inverted pyramid diagram ...
- Switches and relays - Vector stencils library | Design elements ...
- Block diagram - Porter's five forces model | Marketing Diagrams ...
- How to Create Flowchart Using Standard Flowchart Symbols | Cisco ...
- Metropolitan area networks (MAN). Computer and Network ...

