Process Flowchart
The main reason of using Process Flowchart or PFD is to show relations between major parts of the system. Process Flowcharts are used in process engineering and chemical industry where there is a requirement of depicting relationships between major components only and not include minor parts. Process Flowcharts for single unit or multiple units differ in their structure and implementation. ConceptDraw PRO is Professional business process mapping software for making Process flowcharts, Process flow diagram, Workflow diagram, flowcharts and technical illustrations for business documents and also comprehensive visio for mac application. Easier define and document basic work and data flows, financial, production and quality management processes to increase efficiency of your business with ConcepDraw PRO. Business process mapping software with Flowchart Maker ConceptDraw PRO includes extensive drawing tools, rich examples and templates, process flowchart symbols and shape libraries, smart connectors that allow you create the flowcharts of complex processes, process flow diagrams, procedures and information exchange. Process Flowchart Solution is project management workflow tools which is part ConceptDraw Project marketing project management software. Drawing charts, diagrams, and network layouts has long been the monopoly of Microsoft Visio, making Mac users to struggle when needing such visio alternative like visio for mac, it requires only to view features, make a minor edit to, or print a diagram or chart. Thankfully to MS Visio alternative like ConceptDraw PRO software, this is cross-platform charting and business process management tool, now visio alternative for making sort of visio diagram is not a problem anymore however many people still name it business process visio tools.
Types of Flowcharts
A Flowchart is a graphical representation of process, algorithm, workflow or step-by-step solution of the problem. It shows the steps as boxes of various kinds and connects them by arrows in a defined order depicting a flow. There are twelve main Flowchart types: Basic Flowchart, Business Process Modeling Diagram (BPMN), Cross Functional Flowchart, Data Flow Diagram (DFD), IDEF (Integrated DEFinition) Flowchart, Event-driven Process Chain (EPC) Diagram, Influence Diagram (ID), Swimlane Flowchart, Process Flow Diagram (PFD), Specification and Description Language (SDL) Diagram, Value Stream Mapping, Workflow Diagram. Using the Flowcharts solution from the Diagrams area of ConceptDraw Solution Park you can easy and quickly design a Flowchart of any of these types. This solution offers a lot of special predesigned vector symbols for each of these widely used notations. They will make the drawing process of Flowcharts much easier than ever. Pay also attention for the included collection of ready Flowchart examples, samples and quick-start templates. This is business process improvement tools. If you are looking for MS Visio for your Mac, then you are out of luck, because it hasn't been released yet. However, you can use Visio alternatives that can successfully replace its functions. ConceptDraw PRO is an alternative to MS Visio for Mac that provides powerful features and intuitive user interface for the same.
HelpDesk
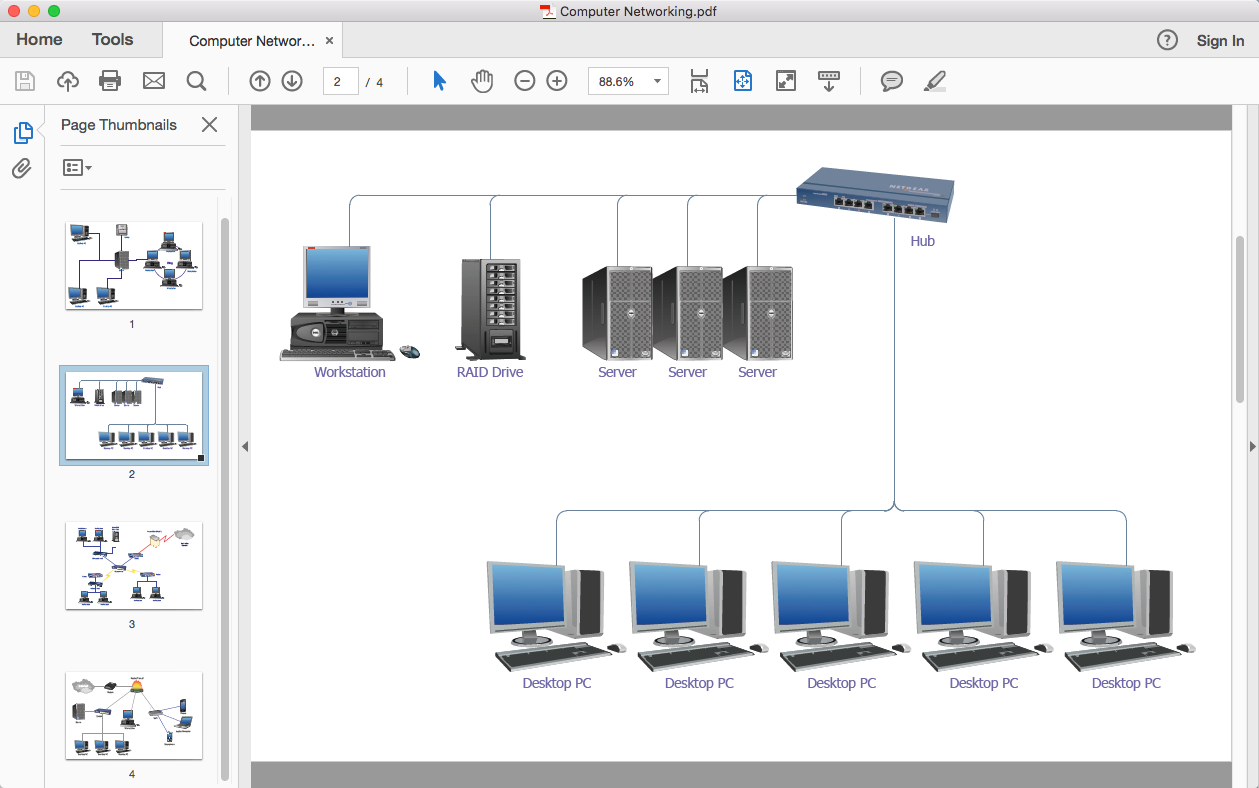
How To Convert a Computer Network Diagram to Adobe PDF
ConceptDraw PRO allows you to easy transmit your network documentation between different computers with different operating systems and applications using it's export capabilities.You can get clear network documentation pack in pdf format and avoid any problems while communicating it with stakeholders.
 Computer Network Diagrams
Computer Network Diagrams solution extends ConceptDraw PRO software with samples, templates and libraries of vector icons and objects of computer network devices and network components to help you create professional-looking Computer Network Diagrams, to plan simple home networks and complex computer network configurations for large buildings, to represent their schemes in a comprehensible graphical view, to document computer networks configurations, to depict the interactions between network's components, the used protocols and topologies, to represent physical and logical network structures, to compare visually different topologies and to depict their combinations, to represent in details the network structure with help of schemes, to study and analyze the network configurations, to communicate effectively to engineers, stakeholders and end-users, to track network working and troubleshoot, if necessary.
 Basic Pie Charts
This solution extends the capabilities of ConceptDraw PRO v10.3.0 (or later) with templates, samples, and a library of vector stencils for drawing pie and donut charts.
Local area network (LAN). Computer and Network Examples
Local Area Network (LAN) is a network which consists of computers and peripheral devices connected each other and to the local domain server, and covers a little territory or small number of buildings, such as home, school, laboratory, office, etc. LAN serves for few hundreds of users. It includes many cables and wires, and demands to design previously a Network diagram. All local area network devices can use the shared printers and disk storage. ConceptDraw PRO is a perfect network diagramming software with examples of LAN Diagrams, templates and predesigned vector objects. ConceptDraw PRO is the ideal choice for network engineers and network designers who need to draw fast and easy Local Area Network Diagrams, for IT specialists, developers and other IT professionals which need to visualize the communication schemes of LAN and visually document the LAN's physical structure and arrangement in houses, offices and other buildings. Ready-to-use vector objects from Computer Network Diagrams solution will help you design LAN diagrams in minutes.
How To Plan and Implement Projects Faster
ConceptDraw Office is the most effective tool for planning, tracking, and reporting all types of projects with strong management capabilities, user friendly functionality, and superior ease of use. In this tutorial video we will assist you in planning and managing a project using ConceptDraw Office.
 Area Charts
Area Charts are used to display the cumulative totals over time using numbers or percentages; or to show trends over time among related attributes. The Area Chart is effective when comparing two or more quantities. Each series of data is typically represented with a different color, the use of color transparency in an object’s transparency shows overlapped areas and smaller areas hidden behind larger areas.
HelpDesk
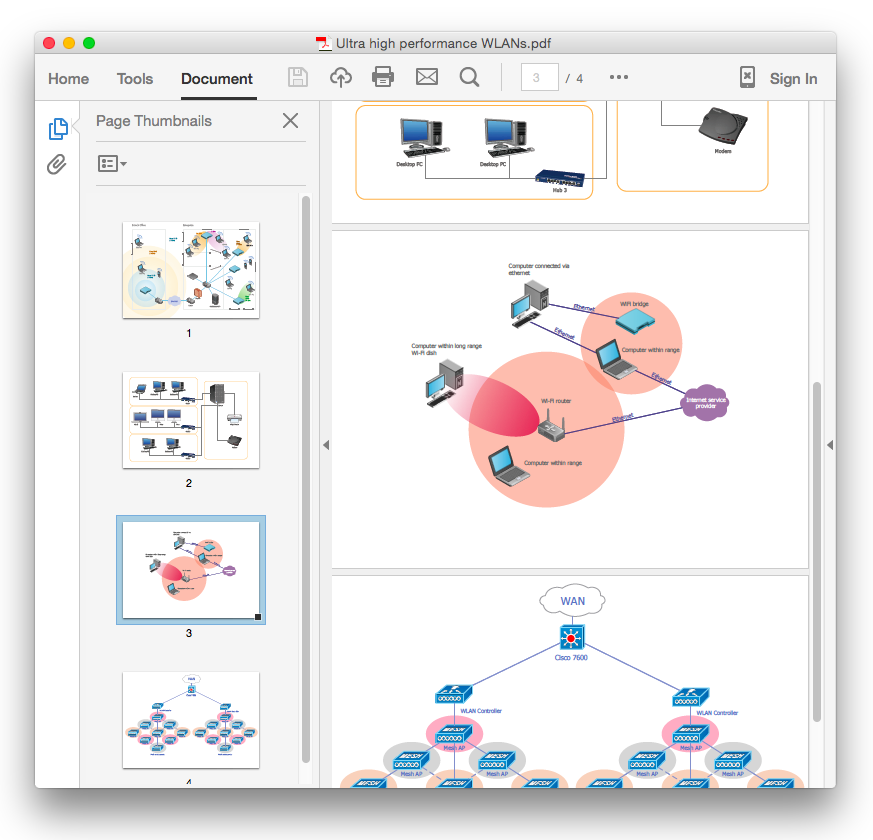
How To Convert a Wireless Network Diagram to Adobe PDF
ConceptDraw PRO allows you to easy transmit your wireless network documentation between different computers with different operating systems and applications using it's export capabilities.You can get clear network documentation pack in pdf format and avoid any problems while communicating it with stakeholders.Sample Pictorial Chart. Sample Infographics
Sample Pictorial Chart - Pictorial Infographics solution provides easy-to-use design infographics drawing tools, large collection of different sample infographics and infograms, sample pictorial chart and templates to be filled in, and 10 libraries with great quantity of predesigned vector pictograms. Use Pictorial Infographics solution to draw your own design pictorial infographics documents quick and easy.In searching of alternative to MS Visio for MAC and PC with ConceptDraw PRO
Undoubtedly MS Visio is a powerful and multifunctional tool, but however at times occur the instances, when it turns unable of meeting certain users' requirements. At this cases you may need to use an alternative program software, preferably it will be simple, convenient, and at the same time powerful and professional. In searching the alternative to MS Visio for MAC and PC we recommend you to pay attention for ConceptDraw PRO software, which was developed to satisfy all your drawing needs and requirements. It is a fully-functioned alternative product to MS Visio for both platforms. ConceptDraw PRO software has many advantages, the main among them are the cross-platform compatibility, a reasonable price, widespread ConceptDraw Solution Park with huge variety of different solutions that offer numerous libraries of specialized vector objects, useful examples, samples, and quick-start templates, extensive import / export capabilities, built-in script language, MS Visio support and certainly free technical support.HelpDesk
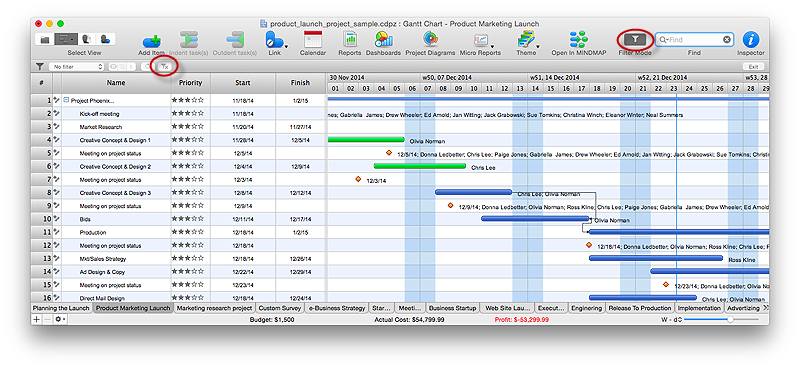
Embedded Filtering Capabilities in ConceptDraw PROJECT for Macintosh
The embedded filters of ConceptDraw PROJECT can be very useful for viewing a specific range of information. You can apply filters to tasks, resources and even projects.
 Picture Graphs
Typically, a Picture Graph has very broad usage. They many times used successfully in marketing, management, and manufacturing. The Picture Graphs Solution extends the capabilities of ConceptDraw PRO v10 with templates, samples, and a library of professionally developed vector stencils for designing Picture Graphs.
 Basic Area Charts
This solution extends the capabilities of ConceptDraw PRO v10.3.0 (or later) with templates, samples and a library of vector stencils for drawing Area Charts (area graphs) that visualize changes in values by filling in the area beneath the line connecting data points.
- Capabilities Of Computer System Flow Chart
- Different Computer Capabilities In A Pie Chart
- Flow Chart Of Operating System Of Computer
- Chart For The Capabilities Of 2 Computers
- Flow Chart Of Operating System Of Computer System
- Percentage Pie Chart . Pie Chart Examples | Bar Diagrams for ...
- Capabilities Of A Laptop And Desktop Computer In A Pie Chart
- Computer Centre Organisation Chart Diagram
- Project Chart Of Computer Network
- Computer On Chart Project
- Organizational Structure Of A Computer Business Centre
- Computer Organizational Chart
- Computer Project For Drawing On Chart
- Gantt Chart For Computer Network Project
- Computer Manufacturing Process Flow Chart
- Gantt Chart Software | Basic Network Diagram | Campus Area ...
- Flow Chart For Computer Operation
- Flow Chart The Simple Computer Network Systems
- Computer Program Flowchart
- Examples of Flowcharts, Org Charts and More | Computer Network ...


