Bubble diagrams in Landscape Design with ConceptDraw DIAGRAM
Bubble Diagrams are the charts with a bubble presentation of data with obligatory consideration of bubble's sizes. They are analogs of Mind Maps and find their application at many fields, and even in landscape design. At this case the bubbles are applied to illustrate the arrangement of different areas of future landscape design, such as lawns, flowerbeds, playgrounds, pools, recreation areas, etc. Bubble Diagram helps to see instantly the whole project, it is easy for design and quite informative, in most cases it reflects all needed information. Often Bubble Diagram is used as a draft for the future landscape project, on the first stage of its design, and in case of approval of chosen design concept is created advanced detailed landscape plan with specification of plants and used materials. Creation of Bubble Diagrams for landscape in ConceptDraw DIAGRAM software is an easy task thanks to the Bubble Diagrams solution from "Diagrams" area. You can use the ready scanned location plan as the base or create it easy using the special ConceptDraw libraries and templates.
 Event-driven Process Chain Diagrams
Event-Driven Process Chain Diagrams solution extends ConceptDraw DIAGRAM functionality with event driven process chain templates, samples of EPC engineering and modeling the business processes, and a vector shape library for drawing the EPC diagrams and EPC flowcharts of any complexity. It is one of EPC IT solutions that assist the marketing experts, business specialists, engineers, educators and researchers in resources planning and improving the business processes using the EPC flowchart or EPC diagram. Use the EPC solutions tools to construct the chain of events and functions, to illustrate the structure of a business process control flow, to describe people and tasks for execution the business processes, to identify the inefficient businesses processes and measures required to make them efficient.
HelpDesk
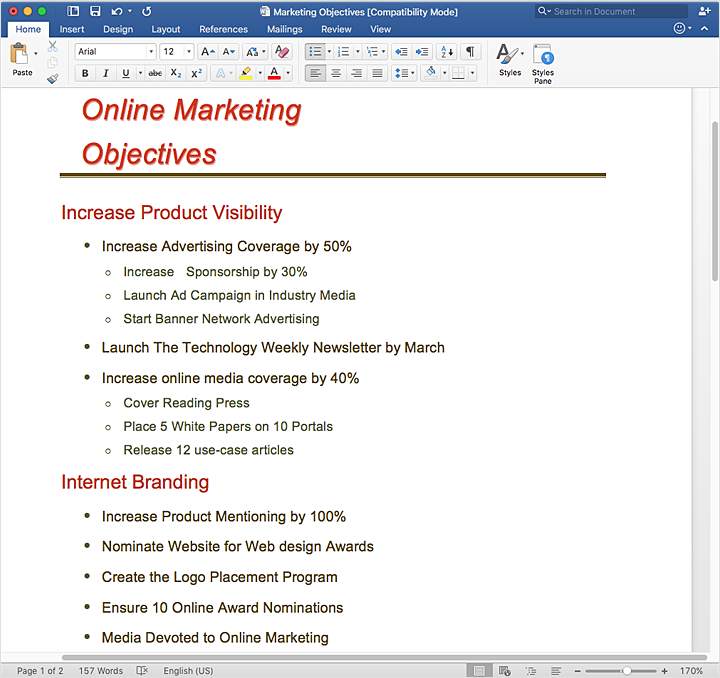
How to Convert a Mind Map into MS Word Document
Mind maps are often used for structuring ideas, planning, and organizing of various documents. ConceptDraw MINDMAP allows you to transfer a mind map to MS Word format using its export facilities. You can convert a mind map to an MS Word outline using the set of standard templates, or even your custom template. Thus, your mind map will be transformed into the proper document format. Using a custom MS Word template allows you to apply your individual style to each document, being exported from ConceptDraw MINDMAP. You can use a mind mapping to capture ideas and structure information. Then make a quick conversion to MS Word and you finally obtain a clean and stylish document.HelpDesk
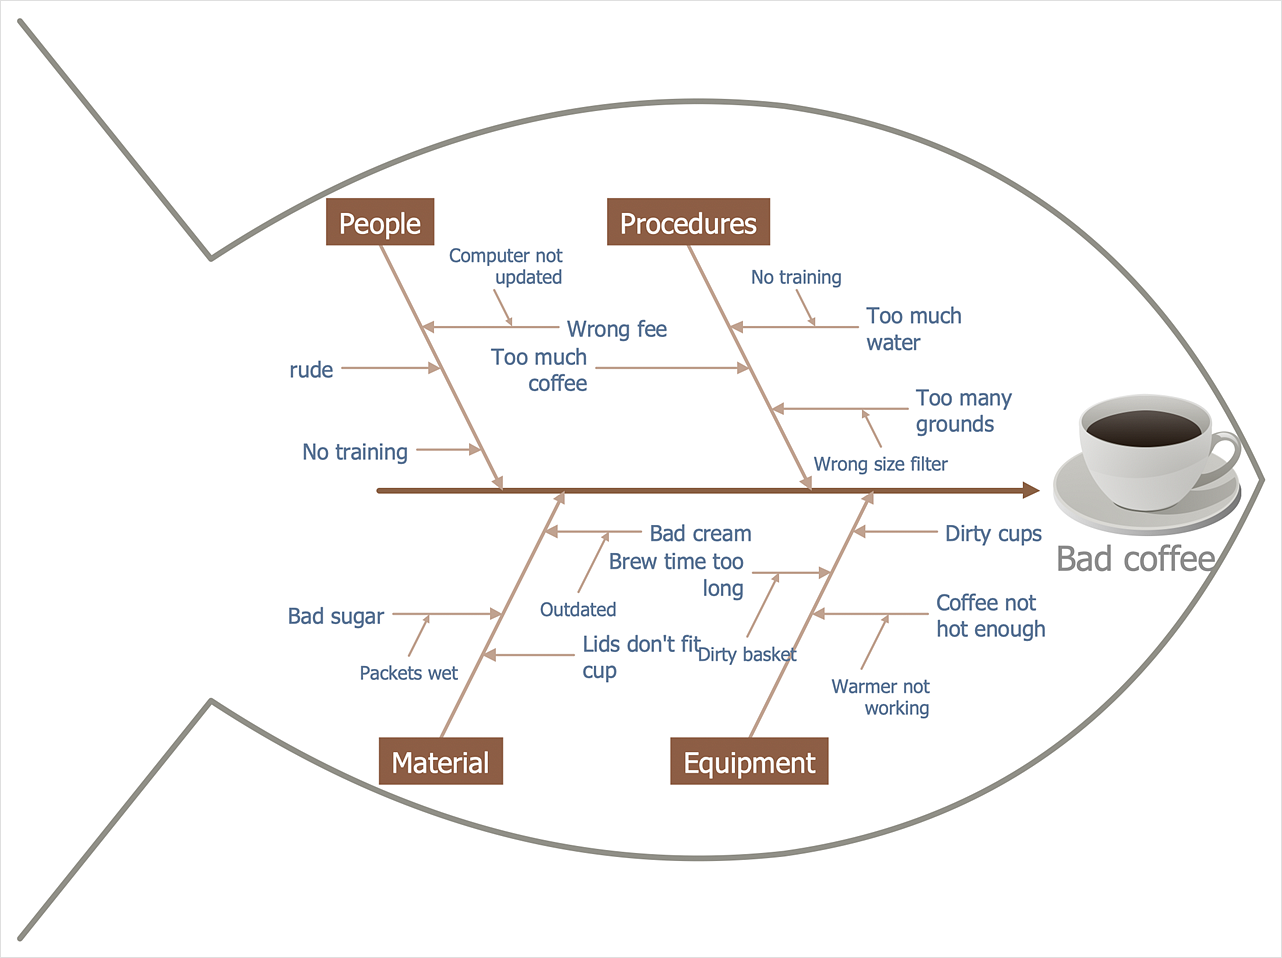
How to Draw a Fishbone Diagram
Fishbone (Ishikawa) Diagram is often used in business to determine the cause of some problem. A Fishbone diagram is also called the cause-and-effect diagram. The main goal of the Fishbone diagram is to illustrate in a graphical way the relationship between a given outcome and all the factors that influence this outcome. The complete diagram resembles a fish skeleton as its name implies. Cause and Effect analysis is used in management to identify the possible causes of a problem in order to eliminate them. The ability to create a Fishbone Diagram is supported by the Fishbone Diagram solution.
 macOS User Interface
macOS User Interface solution extends the ConceptDraw DIAGRAM functionality with powerful GUI software graphic design features and tools. It provides an extensive range of multifarious macOS Sierra user interface design examples, samples and templates, and wide variety of libraries, containing a lot of pre-designed vector objects of Mac Apps icons, buttons, dialogs, menu bars, indicators, pointers, controls, toolbars, menus, and other elements for fast and simple designing high standard user interfaces of any complexity for new macOS Sierra.
HelpDesk
How to Create a Data Flow Diagram
Data flow diagramming is a highly effective technique for showing the flow of information through a system. Data flow diagrams reveal relationships among and between the various components in a program or system. DFD is an important technique for modeling a system’s high-level detail by showing how input data is transformed to output results through a sequence of functional transformations. The set of standard symbols is used to depict how these components interact in a system. ConceptDraw DIAGRAM allows you to draw a simple and clear Data Flow Diagram using special libraries.- Cara Membuat Electrical Plan
- Konsep Membuat Drawing Electric
- Emergency Plan | Cara Buat Evacuation Plan
- Cara Membuat Concept Plan Bubble Diagram
- Cara Membuat Mind Map Di Microsoft Word
- Cara Membuat Mind Mapping Di Microsoft Word
- How To Create Restaurant Floor Plan in Minutes | Flow chart ...
- Cara Membuat Mid Map Di Word
- Cara Membuat Diagram Planning
- Cara Membuat Mind Map Di Word
- Network Layout Floor Plans | Design elements - Network layout ...
- Flow chart Example. Warehouse Flowchart | Swim Lane Flowchart ...
- Membuat Electrical Drawing
- Concept Maps | How to Design a Restaurant Floor Plan | Cafe and ...
- Bubble Diagram For Planning
- Concept Plan Bubble Diagram
- Fire and Emergency Plans | Bar Diagrams for Problem Solving ...
- Bubble diagrams in Landscape Design with ConceptDraw PRO ...
- Entity-Relationship Diagram (ERD) with ConceptDraw PRO ...


