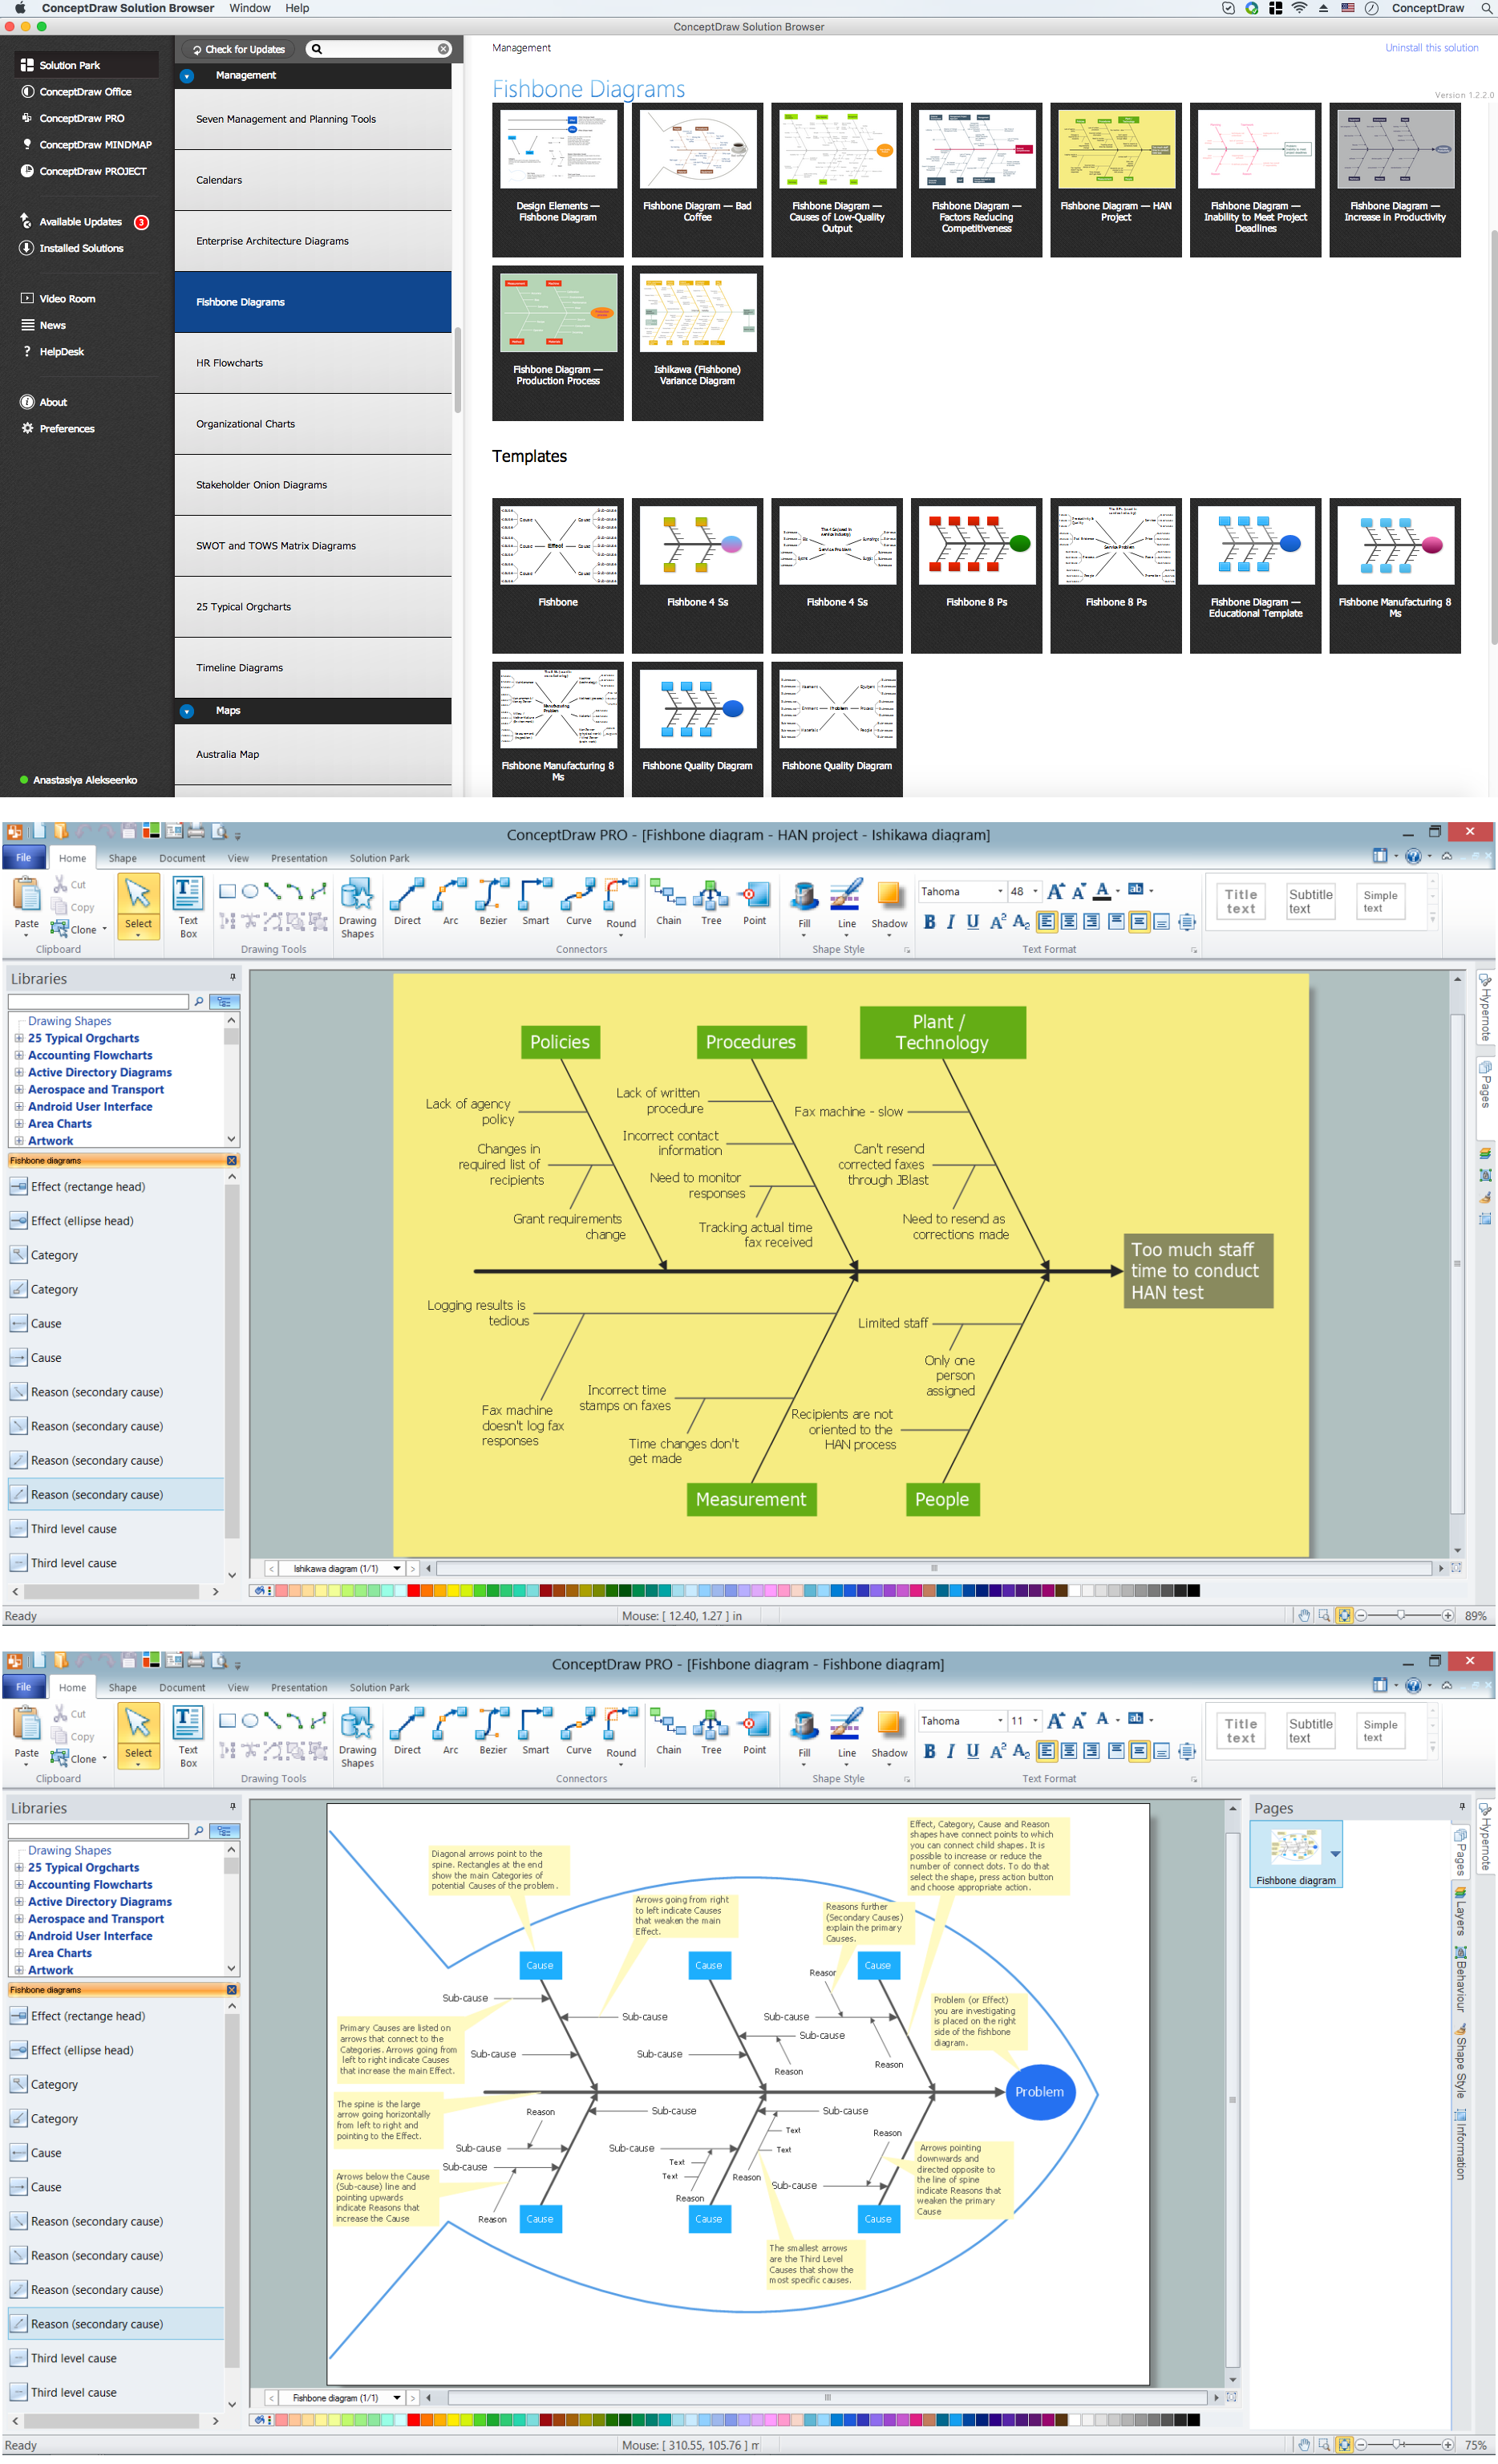
 Fishbone Diagrams
The Fishbone Diagrams solution extends ConceptDraw PRO v10 software with the ability to easily draw the Fishbone Diagrams (Ishikawa Diagrams) to clearly see the cause and effect analysis and also problem solving. The vector graphic diagrams produced using this solution can be used in whitepapers, presentations, datasheets, posters, and published technical material.
Ishikawa Diagram
In almost every sphere of life and work the people time to time are faced with the fact that on their way there are certain obstacles and problems. But it is not always possible to identify the true cause of particular problem. To understand the basic causes of problems and eliminate them, it is convenient to use the chart of Kaoru Ishikawa - the technique specially designed for this. ConceptDraw PRO diagramming and vector drawing software extended with Fishbone Diagrams solution from the Management area can help you with construction the Fishbone Diagram also known as Ishikawa Diagram. Ishikawa Diagram shows factors of Equipment, Process, People, Materials, Environment and Management, all affecting the overall problem in one drawing for the further analysis. It is a well effective way to analyze the business problems you must identify and solve.Cause and Effect Analysis
When you have some problems you need first to explore the reasons which caused them. Cause and Effect Analysis is a perfect way to do this. ConceptDraw PRO software enhanced with Fishbone Diagrams solution from the Management area of ConceptDraw Solution Park gives the ability to draw fast and easy Fishbone diagram that identifies many possible causes for an effect.Create Fishbone Diagrams
Common uses of the Fishbone (Ishikawa) diagrams are product design and quality defect prevention. They are effectively used to identify potential factors causing an overall effect for making possibility to solve a problem. To create Fishbone Diagrams, Cause-and-Effect Diagrams, Ishikawa Diagrams, we recommend to use a ConceptDraw PRO software enhanced with Fishbone Diagrams solution from the Management area of ConceptDraw Solution Park.Fishbone Diagram Procedure
ConceptDraw PRO diagramming and vector drawing software enhanced with Fishbone Diagrams solution from the Management area of ConceptDraw Solution Park gives the ability to draw Fishbone diagram, which identifies many possible causes for an effect for problem solving. Fishbone Diagram procedure of creation includes the set of steps easy for execution in ConceptDraw PRO.PROBLEM ANALYSIS. Prioritization Matrix
ConceptDraw Office suite is a software for Prioritization Matrix diagram making. This diagram ranks the drivers’ factors to determine priority. It identifies the factors of the first priority for analysis of possible corrective actions. It assesses the weight of each factor for each criterion and specifies it in the Prioritization Matrix. The total sum of weights for a factor’s criteria indicates its priority.
Fishbone Diagram Example
Fishbone Diagram, also referred as Cause and Effect diagram or Ishikawa diagram, is a fault finding and problem solving tool. Construction of Ishikawa diagrams is quite complicated process and has a number of features. Fishbone Diagrams solution included to ConceptDraw Solution Park contains powerful drawing tools and a lot of examples, samples and templates. Each Fishbone diagram example is carefully thought-out by experts and is perfect source of inspiration for you.Fishbone Problem Solving
The knowledge and ability to apply various strategies for dealing with problems and difficult situations is very useful in many areas. The Fishbone strategy is one of the most progressive. This graphical technique helps to identify possible causes of problems, to set the goals, and also show internal connections between the different parts of problem. After reviewing all causes and facts, you can easily find right solution. ConceptDraw PRO diagramming and vector drawing software extended with Fishbone Diagrams Solution from the Management Area of ConceptDraw Solution Park is a powerful Fishbone Problem Solving tool.
 Seven Management and Planning Tools
Seven Management and Planning Tools solution extends ConceptDraw PRO and ConceptDraw MINDMAP with features, templates, samples and libraries of vector stencils for drawing management mind maps and diagrams.
 Seven Management and Planning Tools
Seven Management and Planning Tools solution extends ConceptDraw PRO and ConceptDraw MINDMAP with features, templates, samples and libraries of vector stencils for drawing management mind maps and diagrams.
- Fishbone Diagram Problem Solving | Using Fishbone Diagrams for ...
- Ishikawa fishbone diagram | Fishbone diagram - Bad coffee | Total ...
- Fault Tree Analysis Diagrams | PROBLEM ANALYSIS. Root Cause ...
- How To Create a MS Visio Cause and Effect Diagram Using ...
- Using Fishbone Diagrams for Problem Solving | PROBLEM ...
- Cause and Effect Diagrams | Process Flowchart | Cause and Effect ...
- Cause and Effect Analysis | PROBLEM ANALYSIS. Root Cause ...
- When To Use a Fishbone Diagram | Cause and Effect Diagrams ...
- Fishbone Diagram | How to Construct a Fishbone Diagram ...
- Fishbone Diagrams | Fishbone Diagram | Using Fishbone Diagrams ...
- FTA diagram - Hazard analysis | Accident analytic tree - FTA ...
- Root cause analysis tree diagram - Sale problem solution ...
- 7 Management & Planning Tools | Corrective Action Planning | The ...
- Cause and Effect Analysis - Fishbone Diagrams for Problem Solving ...
- Cause and Effect Analysis - Fishbone Diagrams for Problem Solving ...
- Affinity Diagram Software | Affinity Diagram | Affinity Diagram ...
- PROBLEM ANALYSIS. Root Cause Analysis Tree Diagram ...
- Draw Fishbone Diagram on MAC Software | Fishbone Diagram ...
- Fishbone Diagram | Using Fishbone Diagrams for Problem Solving ...
- How to Create a Fishbone (Ishikawa) Diagram Quickly | Fishbone ...


