This site uses cookies. By continuing to browse the ConceptDraw site you are agreeing to our Use of Site Cookies.
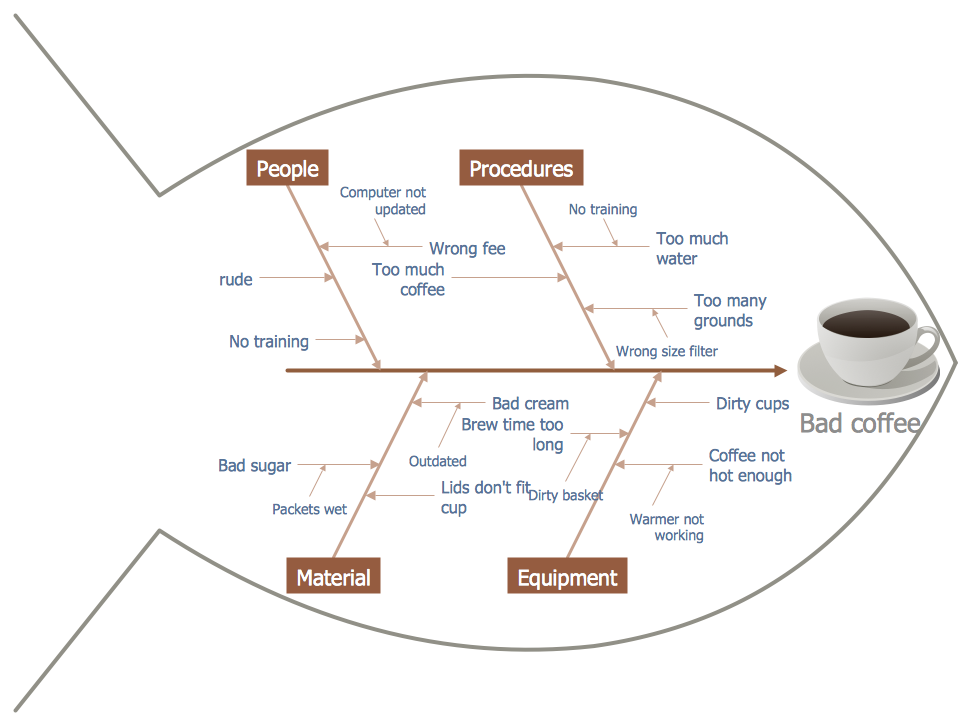
This cause and effect diagram sample was redesigned from the Wikimedia Commons file: Fishbone BadCoffeeExample.jpg. [commons.wikimedia.org/ wiki/ File:Fishbone_ BadCoffeeExample.jpg]
This file is licensed under the Creative Commons Attribution-Share Alike 3.0 Unported license. [creativecommons.org/ licenses/ by-sa/ 3.0/ deed.en]
The fishbone diagram example "Bad coffee" was created using the ConceptDraw PRO diagramming and vector drawing software extended with the Fishbone Diagrams solution from the Management area of ConceptDraw Solution Park.
Fishbone diagram
Fishbone diagram, reason, secondary cause, fishbone, effect, cause, category,

Fishbone Diagram Problem Solving

The Ishikawa diagram, Cause and Effect diagram, Fishbone diagram — all they are the names of one and the same visual method for working with causal connections. Originally invented by Kaoru Ishikawa to control the process quality, the Ishikawa diagram is well proven in other fields of management and personal scheduling, events planning, time management. It is a chart in the form of a fish, whose head is a problem, the fins are variants for its causes.
To design easily the Fishbone diagram, you can use a special ConceptDraw DIAGRAM vector graphic and diagramming software which contains the powerful tools for Fishbone diagram problem solving offered by Fishbone Diagrams solution for the Management area of ConceptDraw Solution Park.

fishbone diagram, Ishikawa diagram, cause and effect analysis Fishbone Diagrams

fishbone diagram, Ishikawa diagram, cause and effect analysis
The Fishbone Diagrams solution extends ConceptDraw DIAGRAM software with the ability to easily draw the Fishbone Diagrams (Ishikawa Diagrams) to clearly see the cause and effect analysis and also problem solving. The vector graphic diagrams produced using this solution can be used in whitepapers, presentations, datasheets, posters, and published technical material.

Fishbone Diagram

Fishbone Diagram is another name for the Cause and Effect Diagram or the Ishikawa Diagram which got its name from the fact that it looks like a fish skeleton. Developed by Kaoru Ishikawa in 1968, a Fishbone Diagram is effectively used for a cause and effect analysis which allows to consider all possible causes for a certain problem or event.
ConceptDraw DIAGRAM supplied with Fishbone Diagrams solution from the Management area is the best software for fast and easy drawing professional looking Fishbone Diagram.

Improving Problem Solving and Focus with Fishbone Diagrams

When you need to focus on the problem, professional diagramming tool helps you create a Fishbone diagram also known as Ishikawa diagram. Understanding of the problem via Fishbone diagram will improve the processes between departments and teams.
ConceptDraw DIAGRAM extended with Fishbone Diagrams solution gives a powerful tool for improving problem solving and focus with Fishbone diagrams.

How to Construct a Fishbone Diagram

Fishbone, Ishikawa or Cause and Effect diagram helps understand the reasons of completed or potential actions by structuring their causes in smaller categories. Also, one can use it to see how the contributing factors are related to each other. In everyday company routine, a Cause and Effect diagram is helpful with a number of regular activities like brainstorming, project management, and problem solving.
How to Construct a Fishbone Diagram? Construction a Fishbone diagram in professional diagramming software ConceptDraw DIAGRAM is more easy than you think. Just use the predesigned vector elements from the Fishbone Diagrams library for Fishbone Diagrams solution or one of plenty Fishbone templates and examples, and you will get a Cause and Effect diagram in minutes.

Using Fishbone Diagrams for Problem Solving

Problems are obstacles and challenges that one should overcome to reach the goal. They are an inseparable part of any business, and the success of an enterprise often depends on ability to solve all problems effectively. The process of problem solving often uses rational approach, helping to find a suitable solution.
Using Fishbone Diagrams for Problem Solving is a productive and illustrative tool to identify the most important factors causing the trouble. ConceptDraw DIAGRAM extended with Fishbone Diagrams solution from the Management area of ConceptDraw Solution Park is a powerful tool for problem solving with Fishbone Ishikawa diagram graphic method.

fault tree analysis, fishbone diagram, cause and effect diagrams, fault tree analysis software, fault tree analysis example Fault Tree Analysis Diagrams

fault tree analysis, fishbone diagram, cause and effect diagrams, fault tree analysis software, fault tree analysis example
This solution extends ConceptDraw DIAGRAM.5 or later with templates, fault tree analysis example, samples and a library of vector design elements for drawing FTA diagrams (or negative analytical trees), cause and effect diagrams and fault tree diagrams.
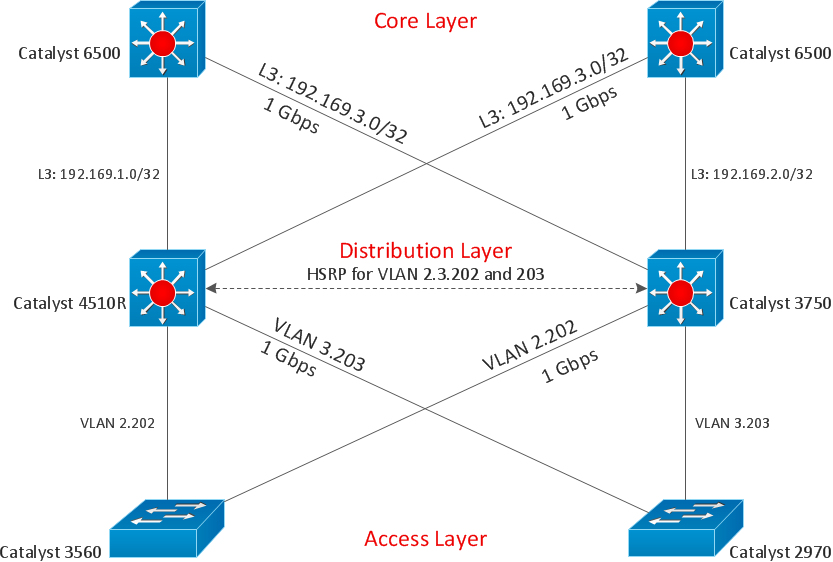
Cisco Design

Cisco Network Diagrams solution from the Computer and Networks area of ConceptDraw Solution Park provides 14 libraries with 450 ready-to-use predesigned vector objects that can be used for quickly and easily drawing the professional Cisco Network Diagrams.

Business diagrams & Org Charts with ConceptDraw DIAGRAM

Business flowcharting tool helps you create a flowchart with minimal effort. With ConceptDraw you can make a flowchart, draw data flow diagrams, orgchart professional, process flow diagrams etc - without any prior knowledge or training.
Draw Business Process Diagrams

Accounts Payable Flowchart

Accounts Payable Flowchart - There is nothing easier than do it in ConceptDraw DIAGRAM. ConceptDraw DIAGRAM diagramming and vector drawing software provides the Accounting Flowcharts Solution from the Finance and Accounting Area of ConceptDraw Solution Park.
The Accounting Flowcharts Solution contains templates, samples and library of ready-to-use predesigned vector objects that will help you create: accounts payable flowchart, accounts payable process flow chart, accounting flowchart of any complexity quick and easy.

Café Floor Plan Example

Once you download ConceptDraw DIAGRAM , which is a professional software for designers, you will find so many tools for making your plans, including lots of design stencils, examples and templates that can be helpful in terms of using them as drafts to edit all of them the way you want to end up having great looking professional floor plans.

UML Use Case Diagram Example. Social Networking Sites Project

UML Diagrams Social Networking Sites Project. This sample was created in ConceptDraw DIAGRAM diagramming and vector drawing software using the UML Use Case Diagram library of the Rapid UML Solution from the Software Development area of ConceptDraw Solution Park.
This sample shows the Facebook Socio-health system and is used at the projection and creating of the social networking sites.

SWOT Analysis Tool for Small Business

SWOT analysis is a method of the making plan to evaluate the Strengths, Weaknesses, Opportunities, and Threats involved in a project. It involves specifying the objective of the project and identifying the internal and external causes for the accomplishing project goals.

Structured Systems Analysis and Design Method (SSADM) with ConceptDraw DIAGRAM

Structured Systems Analysis and Design Method SSADM is the method which is used at projecting and analysis of information systems. SSADM is based on the data flow diagrams. At the description of data flows out of the system and into the system DFD, which denote boundaries of the system, are used.