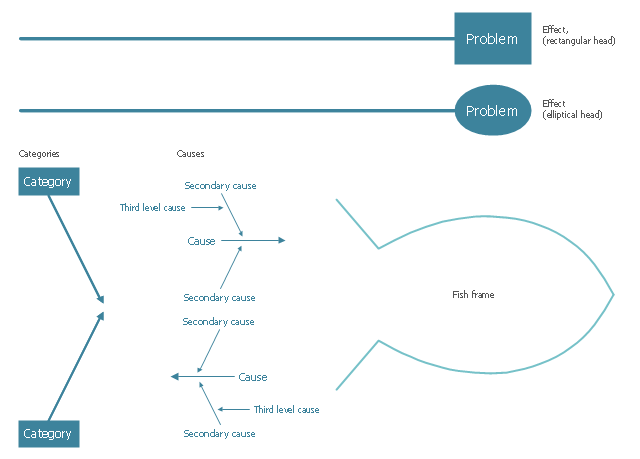
The vector stencils library "Cause-and-effect diagram" contains 13 elements of fishbone diagram.
Use it to design your Ishikawa diagrams with ConceptDraw PRO diagramming and vector drawing software.
"Ishikawa diagrams (also called fishbone diagrams, herringbone diagrams, cause-and-effect diagrams, or Fishikawa) are causal diagrams created by Kaoru Ishikawa (1968) that show the causes of a specific event. Common uses of the Ishikawa diagram are product design and quality defect prevention to identify potential factors causing an overall effect. Each cause or reason for imperfection is a source of variation. Causes are usually grouped into major categories to identify these sources of variation. ...
The basic concept was first used in the 1920s, and is considered one of the seven basic tools of quality control." [Ishikawa diagram. Wikipedia]
The example of fishbone diagram shapes "Design elements - Cause-and-effect diagram" is included in the Seven Basic Tools of Quality solution from the Quality area of ConceptDraw Solution Park.
 Network Layout Floor Plans
Network Layout Floor Plan solution extends ConceptDraw PR software with samples, templates and libraries of vector stencils for drawing the computer network layout floor plans.
 Presentation Exchange
This solution extends ConceptDraw MINDMAP software with the ability to import presentations from Microsoft PowerPoint, as well as enhancing its existing presentation capabilities.
 25 Typical Orgcharts
The 25 Typical Orgcharts solution contains powerful organizational structure and organizational management drawing tools, a variety of professionally designed organization chart and matrix organization structure samples, 25 templates based on various orga
 Sales Flowcharts
The Sales Flowcharts solution lets you create and display sales process maps, sales process workflows, sales steps, the sales process, and anything else involving sales process management.
 Marketing Diagrams
This solution extends ConceptDraw PRO with samples, templates and library of design elements for drawing the marketing diagrams.
 Azure Architecture
Create Microsoft Azure architecture diagrams using icons and templates regarding Azure management, Azure storage and Azure services.
- Fishbone diagram - Causes of low-quality output | Design elements ...
- Fishbone diagram - Causes of low-quality output | Total Quality ...
- Design elements - Cause-and-effect diagram | Fishbone diagram ...
- How to Construct a Fishbone Diagram | Cause and Effect Diagram ...
- Ishikawa Diagram For Problem Defective Product
- Cause and Effect Analysis - Fishbone Diagrams for Problem Solving ...
- Cause and Effect Analysis - Fishbone Diagrams for Problem Solving ...
- Cause and Effect Analysis - Fishbone Diagrams for Problem Solving ...
- Total Quality Management Value | Design elements - Cause-and ...
- Ishikawa Diagram Design Elements
- Total Quality Management with ConceptDraw | Fishbone diagram ...
- Fishbone Diagram | Design elements - Fishbone diagram ...
- Total Quality Management Value | Fishbone diagram - Bad coffee ...
- Cause and Effect Diagram | How Do Fishbone Diagrams Solve ...
- Design elements - Fishbone diagram | Ishikawa Diagram | Using ...
- Manufacturing 8 Ms fishbone diagram - Template | How to Create a ...
- Cause And Effect Diagram Example For Type Of Defects
- Seven Basic Tools of Quality - Fishbone Diagram | Seven Basic ...
- Cause and Effect Diagram | Cause and Effect Analysis | Cause and ...
- TQM Diagram Tool | Fishbone diagram - Causes of low-quality ...
