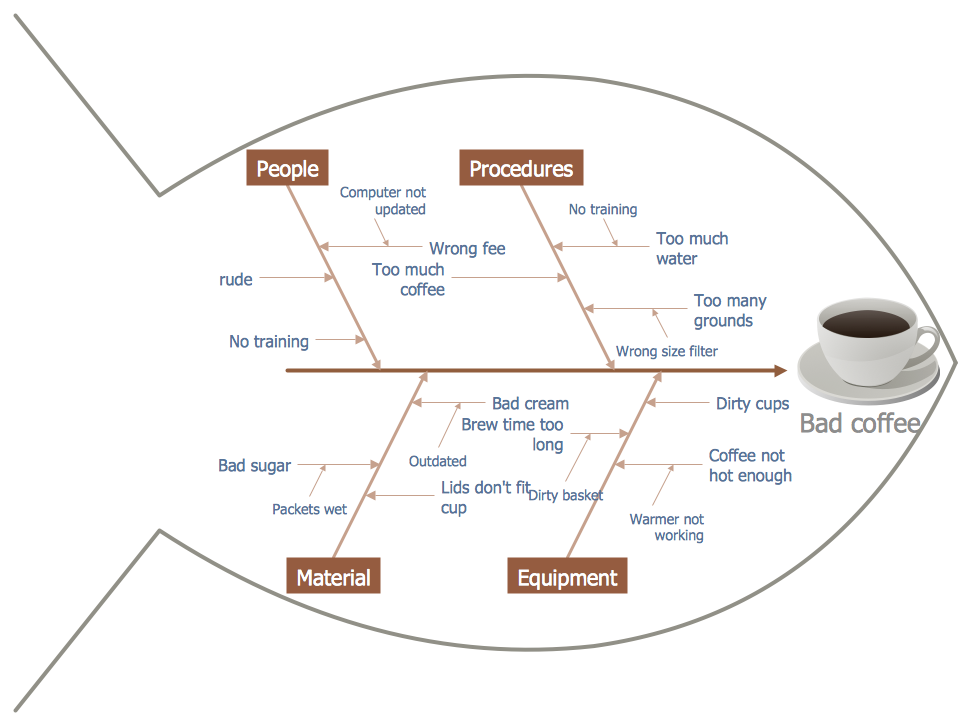
This cause and effect diagram sample was redesigned from the Wikimedia Commons file: Fishbone BadCoffeeExample.jpg. [commons.wikimedia.org/ wiki/ File:Fishbone_ BadCoffeeExample.jpg]
This file is licensed under the Creative Commons Attribution-Share Alike 3.0 Unported license. [creativecommons.org/ licenses/ by-sa/ 3.0/ deed.en]
The fishbone diagram example "Bad coffee" was created using the ConceptDraw PRO diagramming and vector drawing software extended with the Fishbone Diagrams solution from the Management area of ConceptDraw Solution Park.
Personal area (PAN) networks. Computer and Network Examples
Personal area network (PAN) is a network organized on a limited area and used for data transmission between various personal devices, such as computers, tablets, laptops, telephones, different digital and mobile devices, etc. and also for connecting to higher level network and Internet. PAN is used to manage the interconnections of IT devices which surround a single user and generally contains such appliances, as cordless mice, keyboard, phone, and Bluetooth handsets. PANs can be wired with computer buses, or wirelessly connected to the Internet using such network technologies as Bluetooth, Z-Wave, ZigBee, IrDa, UWB, Body Area Network. PANs have a lot of pros and cons, they are expedient, lucrative and handy, but sometimes have bad connection with other networks on the same radio bands, Bluetooth has distance limits and slow data transfer speed, but is comparatively safe. ConceptDraw DIAGRAM diagramming software supplied with numerous solutions of Computer and Networks Area included to ConceptDraw Solution Park perfectly suits for designing the Personal Area Networks.
Fishbone Diagram Problem Solving
The Ishikawa diagram, Cause and Effect diagram, Fishbone diagram — all they are the names of one and the same visual method for working with causal connections. Originally invented by Kaoru Ishikawa to control the process quality, the Ishikawa diagram is well proven in other fields of management and personal scheduling, events planning, time management. It is a chart in the form of a fish, whose head is a problem, the fins are variants for its causes. To design easily the Fishbone diagram, you can use a special ConceptDraw DIAGRAM ector graphic and diagramming software which contains the powerful tools for Fishbone diagram problem solving offered by Fishbone Diagrams solution for the Management area of ConceptDraw Solution Park.
Fishbone Diagram
Fishbone Diagrams solution extends ConceptDraw DIAGRAM software with templates, samples and library of vector stencils for drawing the Ishikawa diagrams for cause and effect analysis.
Using Fishbone Diagrams for Problem Solving
Problems are obstacles and challenges that one should overcome to reach the goal. They are an inseparable part of any business, and the success of an enterprise often depends on ability to solve all problems effectively. The process of problem solving often uses rational approach, helping to find a suitable solution. Using Fishbone Diagrams for Problem Solving is a productive and illustrative tool to identify the most important factors causing the trouble. ConceptDraw DIAGRAM extended with Fishbone Diagrams solution from the Management area of ConceptDraw Solution Park is a powerful tool for problem solving with Fishbone Ishikawa diagram graphic method.Fishbone Diagram
Fishbone Diagram is another name for the Cause and Effect Diagram or the Ishikawa Diagram which got its name from the fact that it looks like a fish skeleton. Developed by Kaoru Ishikawa in 1968, a Fishbone Diagram is effectively used for a cause and effect analysis which allows to consider all possible causes for a certain problem or event. ConceptDraw DIAGRAM supplied with Fishbone Diagrams solution from the Management area is the best software for fast and easy drawing professional looking Fishbone Diagram.
Fishbone Diagrams
The Fishbone Diagrams solution extends ConceptDraw DIAGRAM software with the ability to easily draw the Fishbone Diagrams (Ishikawa Diagrams) to clearly see the cause and effect analysis and also problem solving. The vector graphic diagrams produced using this solution can be used in whitepapers, presentations, datasheets, posters, and published technical material.
Improving Problem Solving and Focus with Fishbone Diagrams
When you need to focus on the problem, professional diagramming tool helps you create a Fishbone diagram also known as Ishikawa diagram. Understanding of the problem via Fishbone diagram will improve the processes between departments and teams. ConceptDraw DIAGRAM extended with Fishbone Diagrams solution gives a powerful tool for improving problem solving and focus with Fishbone diagrams.- Fishbone Diagram Problem Solving | Using Fishbone Diagrams for ...
- Fishbone Diagram | Fishbone Diagrams | Causes For Poor Drawing ...
- Cause and Effect Analysis - Fishbone Diagrams for Problem Solving ...
- Cause And Effect Diagram For Poor Quality Product
- Cause And Effect Diagram Poor Quality Education
- Fishbone Diagram Poor Quality Of Product
- Fishbone diagram - Bad coffee | Cause and effect diagram ...
- Fishbone Diagrams | Fishbone Diagram | Fish Bone Diagram Poor ...
- Cause And Effect Diagram For Bad Coffee
- Fishbone Diagrams | Fishbone Diagram | Poor Product Quality Causes
- Fishbone Diagrams | Fishbone diagram - Bad coffee | Fishbone ...
- Fishbone diagram - Causes of low-quality output | Fishbone diagram ...
- Example Poor Of Quality Education Cause And Effect Diagram
- Fishbone Diagram | Draw Fishbone Diagram on MAC Software ...
- Ishikawa Diagram | Total Quality Management Value | Using ...
- Fishbone Diagrams | Fishbone Diagram | Flowchart On Poor Fish ...
- Using Fishbone Diagrams for Problem Solving | Fishbone Diagram ...
- Draw Fishbone Diagram on MAC Software | Ishikawa Diagram ...
- Fishbone Diagram Example For Poor Education
- Fishbone diagram - Bad coffee | Fishbone Diagrams | Using ...