HelpDesk
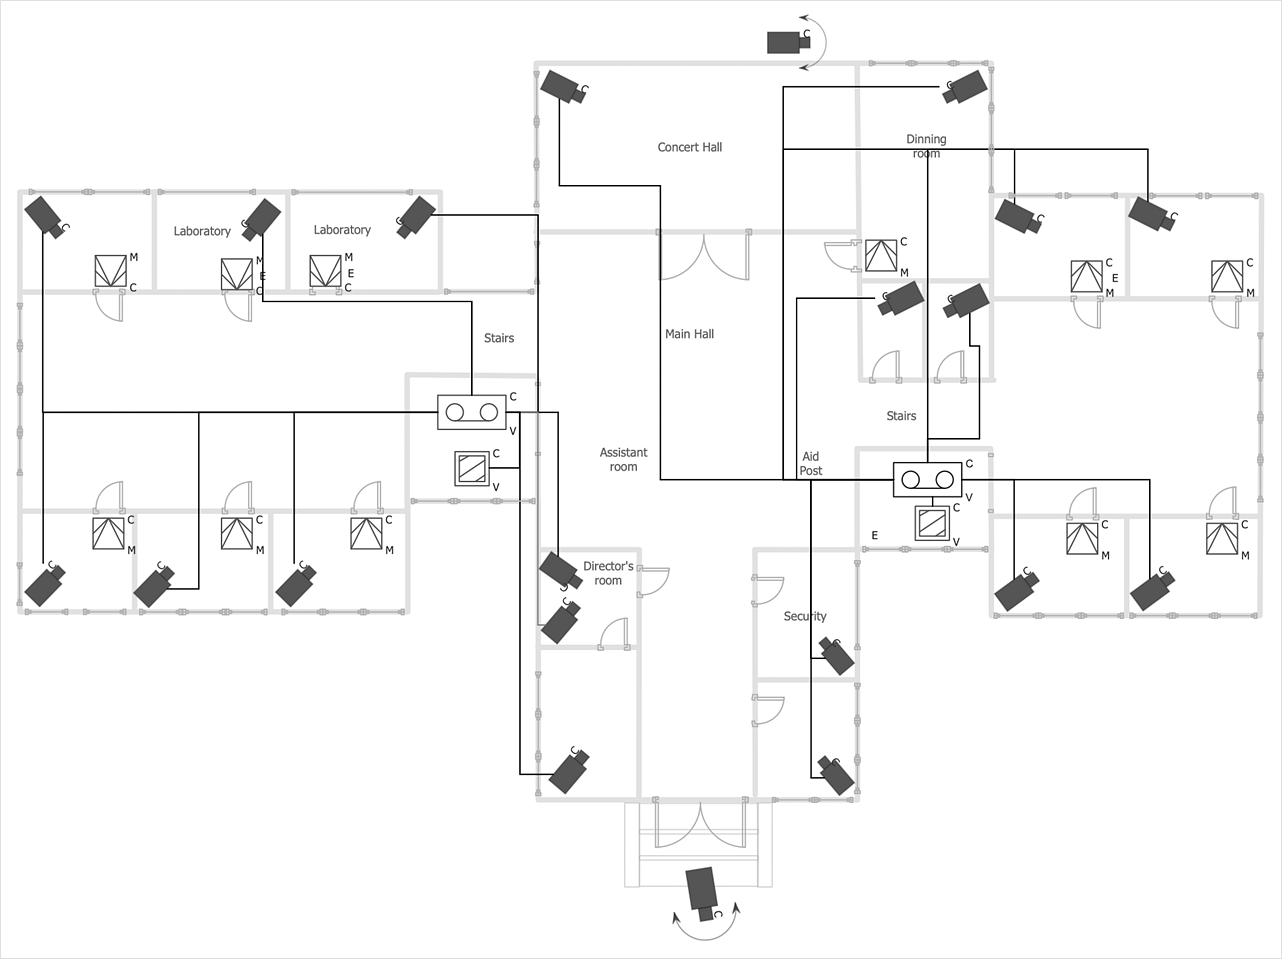
How to Create a CCTV Diagram
CCTV (Closed-circuit television) diagram is used to depict a system of video monitoring. The CCTV diagram provides video cameras placement strategy. CCTV diagram should include the scheme of strategic placement of video cameras, which capture and transmit videos to either a private network of monitors for real-time viewing or to a video recorder for later reference. CCTV is commonly used for surveillance and security purposes. Using ConceptDraw DIAGRAM with the Security and Access Plans Solution lets you create professional looking video surveillance CCTV system plans, security plans, and access schemes.Entity Relationship Diagram - ERD - Software for Design Crows Foot ER Diagrams
ER-model is a data model which lets describe the conceptual schemes in a specific subject area. It can help to highlight the key entities and specify relationships that can be established between these entities. During the database design, it is realized the transformation of ER model into certain database scheme based on the chosen data model (relational, object, network, etc.). There are used two notations for ERDs: Crow's Foot and Chen's. Crow's Foot notation proposed by Gordon Everest represents the entity by rectangle containing its name (name must be unique within this model), and relation - by the line which links two entities involved in relationship. The relationship's plurality is graphically indicated by a "plug" on the end of the link, the optionality - by a circle. Entity-Relationship Diagrams based on Crow's Foot notation can be easily drawn using the ConceptDraw DIAGRAM. Extended with Entity-Relationship Diagram (ERD) solution, it is the best ERD diagrams software with powerful tools and ready design elements for Crow's Foot and Chen notations.
Structured Systems Analysis and Design Method (SSADM) with ConceptDraw DIAGRAM
Structured Systems Analysis and Design Method (abbr. SSADM) is a method developed in Great Britain and accepted in 1993 as a national standard for information systems development and analysis. SSADM is based on Data Flow Diagrams and is characterized with presence of clear sequence of steps at projecting, analysis, and documenting of information system. It involves 6 main stages: analysis of existing system or estimation of practicability, requirements definition, determination of technical requirements and equipment cost, development of logical data model, projecting of logical requirements and specification them, physical projecting. Each of them is also divided into several steps defining the tasks that should be fulfilled at a given stage. The most important SSADM elements are flows modeling with help of DFD, data logic modeling with help of LDS (Logical Data Structure) and description of entities behavior. Applying of SSADM is easy with ConceptDraw DIAGRAM diagramming and vector drawing software and Data Flow Diagram solution.- Basic CCTV System Diagram . CCTV Network Diagram Example ...
- Cctv Diagram Designer Torrent
- UML Component Diagram . Design Elements | Diagramming ...
- Entity Relationship Diagram - ERD - Software for Design Crows Foot ...
- Entity Relationship Diagram - ERD - Software for Design Crows Foot ...
- UML Composite Structure Diagram . Design Elements | UML Block ...
- CCTV Network Example | How to Create a CCTV Diagram in ...
- Network Diagramming Software for Design Cisco Network Diagrams
- How to Create a CCTV Diagram in ConceptDraw PRO | How To ...
- Interior Design Piping Plan - Design Elements | Network ...
- Audio, Video, Media | How To Create CCTV Network Diagram ...
- Campus Area Networks (CAN). Computer and Network Examples ...
- Data flow Model Diagram
- System Context Diagram
- How To Create CCTV Network Diagram | How to Create a CCTV ...
- Total Quality Management TQM Diagrams | Block Diagram Creator ...
- Electrical Drawing Software | Wiring Diagrams with ConceptDraw ...
- Business Processes | Venn Diagrams | How to Create an IDEF0 ...
- How To use House Electrical Plan Software | How to Create a CCTV ...

_Win_Mac.png)
