Diagram Software - The Best Choice for Diagramming
For vector shapes and connector tools for quick and easy drawing diagrams for business, technology, science and education - The best choice for Diagramming is ConceptDraw PRO.Databases Access Objects Model with ConceptDraw PRO
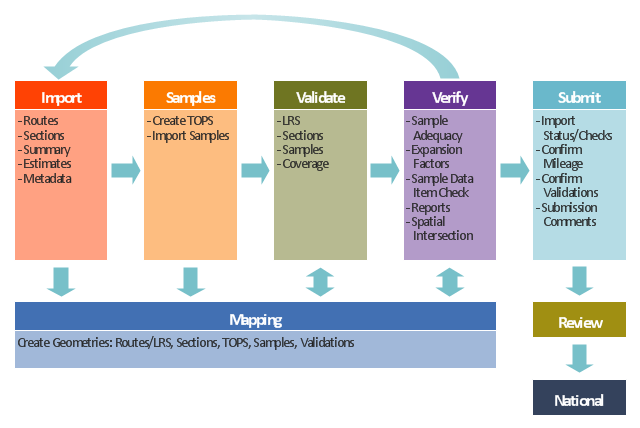
ConceptDraw Basic gives the opportunity of interaction with any ODBC-compatible databases. For this the Database Access Objects Model is provided. All calls to the database are made by certain methods of objects of this model.This TQM diagram example was redesigned from the illustration of the Highway Performance Monitoring System (HPMS) Field Manual from the website of the Federal Highway Administration (FHWA).
[fhwa.dot.gov/ policyinformation/ hpms/ fieldmanual/ chapter7.cfm]
"Highway Performance Monitoring System (HPMS).
The HPMS is a national level highway information system that includes data on the extent, condition, performance, use and operating characteristics of the nation's highways. The HPMS contains administrative and extent of system information on all public roads, while information on other characteristics is represented in HPMS as a mix of universe and sample data for arterial and collector functional systems. Limited information on travel and paved miles is included in summary form for the lowest functional systems.
HPMS was developed in 1978 as a continuing database, replacing the special biennial condition studies that had been conducted since 1965. The HPMS has been modified several times since its inception. Changes have been made to reflect changes in the highway systems, legislation, and national priorities, to reflect new technology, and to consolidate or streamline reporting requirements." [fhwa.dot.gov/ policyinformation/ hpms.cfm]
The TQM flowchart example "Software workflow diagram" was created using the ConceptDraw PRO diagramming and vector drawing software extended with the Total Quality Management (TQM) Diagrams solution from the Quality area of ConceptDraw Solution Park.
Cross Functional Flowchart for Business Process Mapping
Start your business process mapping with conceptDraw PRO and its Arrows10 Technology. Creating a process map, also called a flowchart, is a major component of Six Sigma process management and improvement. Use Cross-Functional Flowchart drawing software for business process mapping (BPM). Use a variety of drawing tools, smart connectors and shape libraries to create flowcharts of complex processes, procedures and information exchange. Define and document basic work and data flows, financial, production and quality management processes to increase efficiency of you business.- Characteristics Of Good Flowchart
- Process Flowchart | ConceptDraw Arrows10 Technology | The Best ...
- Algorithm And Flowchart Their Functions And Characteristics
- Concept Mapping | Cross-Functional Flowchart | Concept Map ...
- Best Diagramming Software for Mac | Flow chart Example ...
- Characteristics Of Cmunication
- Concept Map Maker | How To Make a Concept Map | The Best ...
- Team psychological characteristics - Concept map | Concept ...
- How to Create a HR Process Flowchart Using ConceptDraw PRO ...
- Cross-Functional Flowchart (Swim Lanes) | Swim Lane Diagrams ...
- Safety and Security | Team psychological characteristics - Concept ...
- Process Flowchart | Project Management Area | Characteristics Of ...
- Process Flowchart | Structured Systems Analysis and Design ...
- Tqm Flowchart Example
- Process Flowchart | Cross Functional Flowchart for Business ...
- Process Flowchart | How To use House Electrical Plan Software ...
- Software workflow diagram | Process Flowchart | TQM Tools ...
- Team psychological characteristics - Concept map | Concept Maps ...
- The Best Choice for Creating Diagram | ConceptDraw Arrows10 ...
- The Best Flowchart Software Available | How To Make a Concept ...


