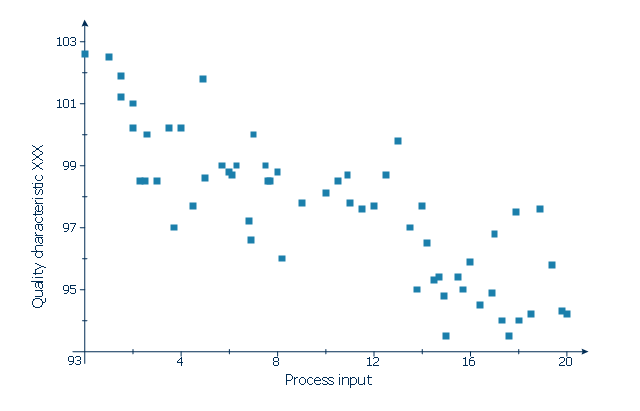
This scatter graph (scattergraph. scatter chart, scatter plot, scatterplot, scatter diagram) example depicts quality characteristic vs. process input. It was designed on the base of the Wikimedia Commons file: Scatter diagram for quality characteristic XXX.svg. [commons.wikimedia.org/ wiki/ File:Scatter_ diagram_ for_ quality_ characteristic_ XXX.svg]
This file is licensed under the Creative Commons Attribution-Share Alike 3.0 Unported license. [creativecommons.org/ licenses/ by-sa/ 3.0/ deed.en]
"Scatterplots are used to graphically display the relationship between two variables. They are commonly used to accompany correlational analyses." [Scatterplot. Wikiversity]
The scatter chart example "Quality characteristic XXX" was created using the ConceptDraw PRO diagramming and vector drawing software extended with the Scatter Diagrams solution from the Graphs and Charts area of ConceptDraw Solution Park.
ConceptDraw Arrows10 Technology
How should diagramming software work? The answer is - Fast and easy. "Tree"- mode drawing works like that. Just select objects in your drawing and press Tree or Chain button to connect all of them just in one click. Your diagram looks professional and it took only a moment to draw.Gantt charts for planning and scheduling projects
ConceptDraw PROJECT is an excellent simple project scheduling software. It maintain classic project gantt charts and the line of professional reports on resources usage. It include handy critical path scheduling software tools and diagraming tools which helps prepare the presentation of project status. It include project tracking dashboard to keep project metrics upto date, also it have handy feature to export project management dashboard in excel file.- Features Of Planning In Flow Chart
- Characteristics Of Flowchart
- Basic Flowchart Symbols and Meaning | Process Flowchart | How to ...
- Process Flowchart | Venn Diagrams | Pyramid Diagram | Show The ...
- Basic Flowchart Symbols and Meaning | Technical Flow Chart ...
- Basic Flowchart Symbols and Meaning | Types of Flowcharts ...
- Technical Flow Chart | The Best Choice for Creating Diagram ...
- Process Flowchart | Project Management Area | Characteristics Of ...
- Process Flowchart | Project Management Area | Pie Chart On ...
- Project Management Area | Process Flowchart | Characteristics Of ...
- Process Flowchart | Basic Flowchart Symbols and Meaning | Cross ...
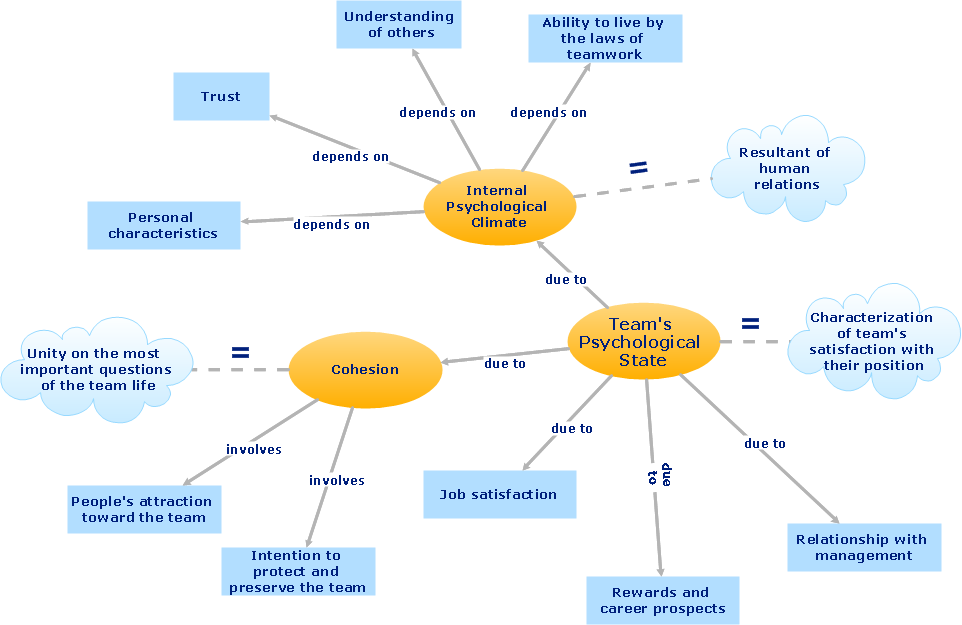
- Team psychological characteristics - Concept map | Process ...
- Basic Flowchart Symbols and Meaning | Process Flowchart | The ...
- Characteristics Of Flow Chart
- Basic Flowchart Symbols and Meaning | Process Flowchart | Cross ...
- Process Flowchart | Structured Systems Analysis and Design ...
- Significant characteristics of pedestrian crashes | Land sales ...
- Process Flowchart | Chore charts with ConceptDraw PRO ...
- Flow Chart Importance And Characteristics Of Flow Chart Ppt
- Characteristics Of Good Flowchart


