 Seating Plans
The correct and convenient arrangement of tables, chairs and other furniture in auditoriums, theaters, cinemas, banquet halls, restaurants, and many other premises and buildings which accommodate large quantity of people, has great value and in many cases requires drawing detailed plans. The Seating Plans Solution is specially developed for their easy construction.
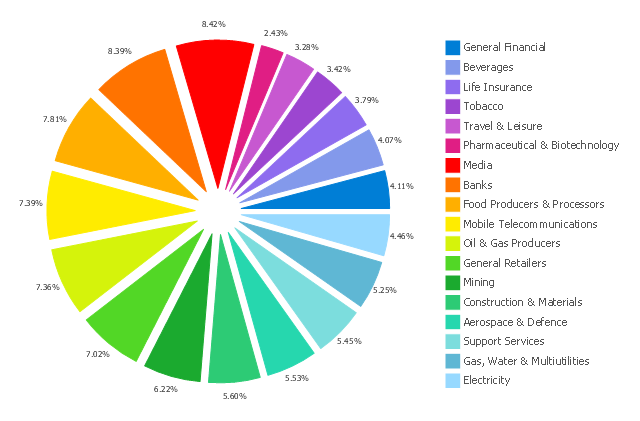
This exploded pie chart sample shows the economic sector weightings. It was designed on the base of the Wikimedia Commons file: Badpie.png [commons.wikimedia.org/ wiki/ File:Badpie.png].
This image is available under the Creative Commons Attribution-ShareAlike 3.0 Unported License [creativecommons.org/ licenses/ by-sa/ 3.0/ ].
"The classical breakdown of all economic sectors follows:
Primary: Involves the retrieval and production of raw materials, such as corn, coal, wood and iron. (A coal miner and a fisherman would be workers in the primary sector.)
Secondary: Involves the transformation of raw or intermediate materials into goods e.g. manufacturing steel into cars, or textiles into clothing. (A builder and a dressmaker would be workers in the secondary sector.)
Tertiary: Involves the supplying of services to consumers and businesses, such as baby-sitting, cinema and banking. (A shopkeeper and an accountant would be workers in the tertiary sector.)
In the 20th century, it began to be argued that traditional tertiary services could be further distinguished from "quaternary" and quinary service sectors." [Economic sector. Wikipedia]
The exploded pie chart example "Economic sector weightings" was created using the ConceptDraw PRO diagramming and vector drawing software extended with the Pie Charts solution of the Graphs and Charts area in ConceptDraw Solution Park.
"Time management is the .. process of planning and exercising conscious control over the amount of time spent on specific activities, especially to increase effectiveness, efficiency or productivity. Time management may be aided by a range of skills, tools, and techniques used to manage time when accomplishing specific tasks, projects, and goals complying with a due date. Initially, time management referred to just business or work activities, but eventually the term broadened to include personal activities as well. A time management system is a designed combination of processes, tools, techniques, and methods. Time management is usually a necessity in any project development as it determines the project completion time and scope." [Time management. Wikipedia]
This timetable pie chart shows the plan of daily actions and its durations in minutes.
It is useful visual tool of personal time management.
This schedule pie chart example was created using the ConceptDraw PRO diagramming and vector drawing software extended with the Target and Circular Diagrams solution from the Marketing area of ConceptDraw Solution Park.
www.conceptdraw.com/ solution-park/ marketing-target-and-circular-diagrams
- Free Org Chart Builder
- Flow Chart Builder
- Organizational Chart Builder
- Online Organizational Chart Builder
- Flow Chart Online | How to Create a Social Media DFD Flowchart ...
- Building Drawing Software for Design Seating Plan | Seating Plans ...
- Free Flow Chart Builder
- ConceptDraw Solution Park | Event-Driven Process Chain Diagram ...
- How to Add a Bubble Diagram to a PowerPoint Presentation Using ...
- Flow Chart Of Algorithm Example 7 Diagram
- Online Flowchart Builder
- Professions - Vector stencils library | Organizational chart ...
- Chart Templates | Professions - Vector stencils library | Ranks US ...
- Sample Project Flowchart. Flowchart Examples | Flowchart ...
- Professions - Vector stencils library | HR professions - Vector ...
- Financial Flow Chart Examples
- How to Create a Pie Chart | How to Draw the Different Types of Pie ...
- Accounts Payable Flowchart | Accounting Flowcharts | Accounts ...
- Table Seating Chart Template | Seating Plans | Building Drawing ...
- Flow chart Example. Warehouse Flowchart | HR professions - Vector ...

