Flow Chart Design - How to Design a Good Flowchart

Process Flowchart


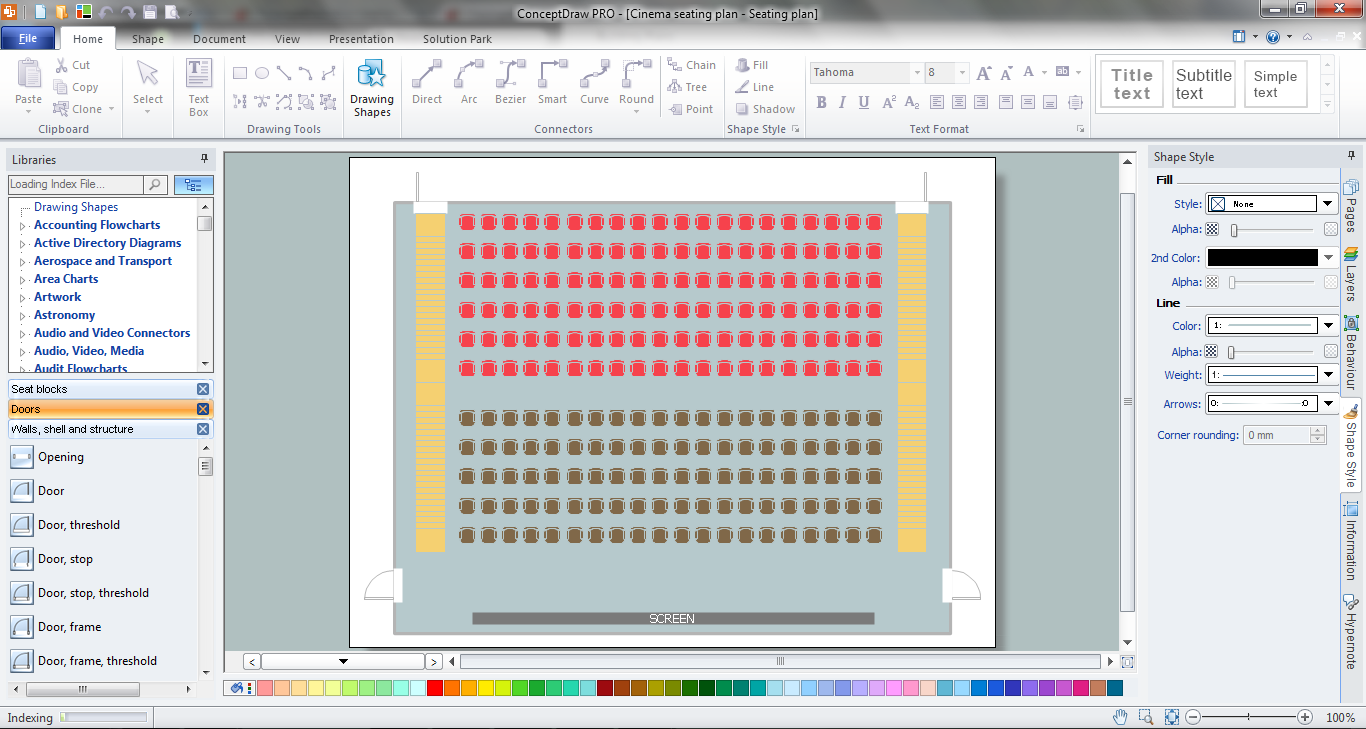
Seating Chart Template Free
This picture bar graph sample shows the computer and Internet use at home from 1984 to 2014. It was designed using data from website of the United States Census Bureau (USCB).
[census.gov/ content/ dam/ Census/ library/ visualizations/ 2016/ comm/ digital_ nation.png]
"Home automation is the residential extension of building automation and involves the control and automation of lighting, heating, ventilation, air conditioning (HVAC), appliances, and security. Modern systems generally consist of switches and sensors connected to a central hub sometimes called a "gateway" from which the system is controlled with a user interface that is interacted either with a wall-mounted terminal, mobile phone software, tablet computer or a web interface." [Home automation. Wikipedia]
The pictorial chart example "Computer and Internet use at home over time" was created using the ConceptDraw PRO diagramming and vector drawing software extended with the Picture Graphs solution from the Graphs and Charts area of ConceptDraw Solution Park.
Image chart

Examples of Flowcharts, Org Charts and More


Online Flow Chart

Flowchart Definition

Pictorial Chart

 Computer and Network Package
Computer and Network Package is a large set of valuable graphical solutions from ConceptDraw Solution Park, developed and specially selected to help computer network specialists and IT professionals to realize their daily work the most efficiently and quickly. This package contains extensive set of graphic design tools, ready-to-use vector elements, built-in templates and samples for designing professional-looking diagrams, charts, schematics and infographics in a field of computer network technologies, cloud computing, vehicular networking, wireless networking, ensuring networks security and networks protection. It is useful for designing different floor plans and layout plans for homes, offices, hotels and instantly construction detailed schemes of computer networks and wireless networks on them, for making professional-looking and colorful Pie Charts, Bar Graphs and Line Charts visualizing the relevant information and data.
 Pie Charts
Pie Charts are extensively used in statistics and business for explaining data and work results, in mass media for comparison (i.e. to visualize the percentage for the parts of one total), and in many other fields. The Pie Charts solution for ConceptDraw DIAGRAM offers powerful drawing tools, varied templates, samples, and a library of vector stencils for simple construction and design of Pie Charts, Donut Chart, and Pie Graph Worksheets.
- Chart On Computer Networks
- Computer Organizational Chart
- Bio Flowchart | Computer Manufacturing Process Flow Chart
- Top 5 Android Flow Chart Apps | How to Create a Computer ...
- Components Of Computer Flow Chart Symbols And Its Function
- Computer Drawing Pic With Chart
- Computer Chart By 10th Class
- Organizational Structure Of A Computer Business Centre
- Logistics Flow Charts | Process Flow Diagram Of Computer ...
- Network organization chart | Network Diagrams for Bandwidth ...