Flowchart Example: Flow Chart of Marketing Analysis
An example flowchart of marketing analysis shows main steps you have to challenge writing a marketing analysis.Flowchart Software
Flowchart is a simple diagram, map or graphical schematic representation the sequence of actions within a process. It is ideal for displaying how a process currently flows or can function ideally. The Flowcharts let define the steps and boundaries of a process, uncover problems or miscommunications. The Flowcharts are widely used in education, software development, business, economics, thanks to their visuality they are ideal for presentations, reports, for using on conferences to help the audience comprehend the content better, or easy find flaws in a process flow diagrams. ConceptDraw PRO is professional flowcharts software and feature-rich flowchart maker, which supports Mac OS X and Windows. It contains at ConceptDraw Solution Park a rich set of stencils and professional flowchart symbols for design. It lets create simply professional-looking Flowcharts based on thousand free flowchart templates, colored symbols and examples. ConceptDraw PRO is a 3 times cheaper alternative to MS Visio available for both Mac and PC. It’s is another full featured business and technical diagramming application that can easily take care of Visio files within OS X. Another bonus with ConceptDraw PRO – it's cross-platform. You can work on a document in both OS X and Windows, skipping Visio entirely.
Marketing Organization Chart
You need design the Marketing Organization Chart and look for effective software? Now it's incredibly easy to do this in ConceptDraw PRO which was supplied with Marketing Diagrams Solution from the Marketing Area of ConceptDraw Solution Park.Daily Schedule Chart
ConceptDraw PRO diagramming and vector drawing software extended with Target and Circular Diagrams solution from the Marketing area of ConceptDraw Solution Park is a powerful tool for Daily Schedule Chart design.HelpDesk
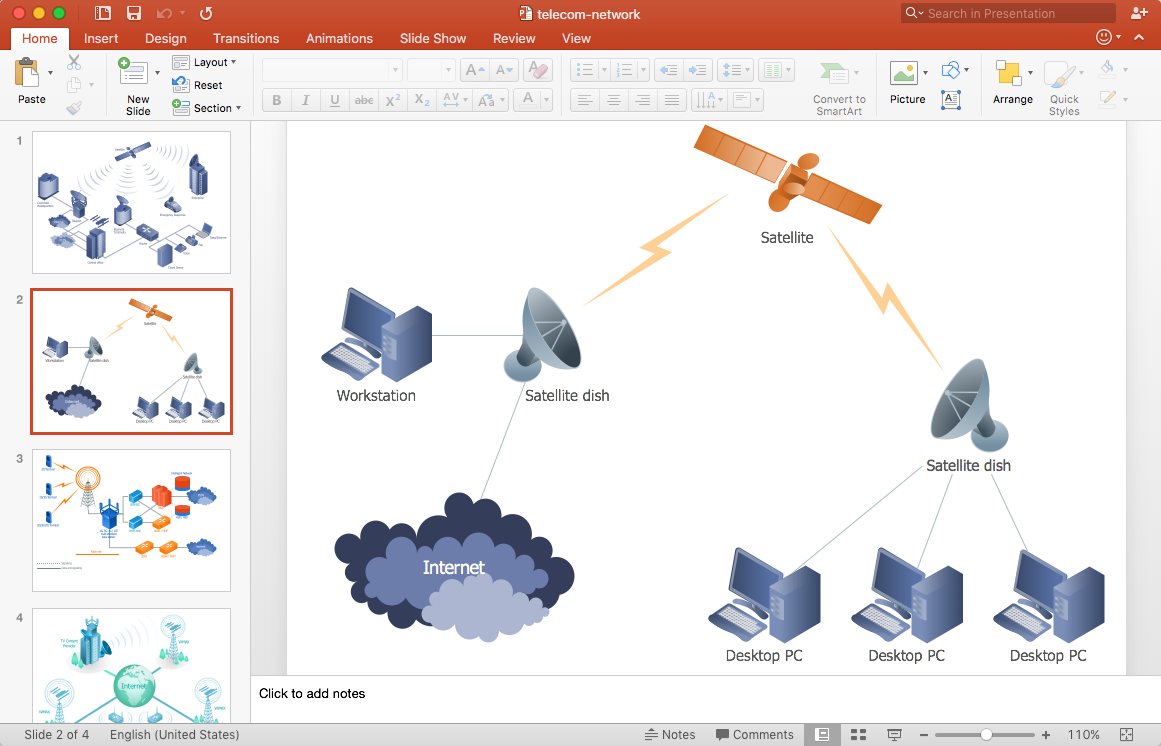
How to Add a Telecommunication Network Diagram to a PowerPoint Presentation
Telecommunication network diagram represents a system consisting of computers, servers, telecommunication devices, switches, satellites, wireless transmitters, antennas, cables, etc., that link a set of remote nodes. It is also describes a telephone exchange, that connects calls between landlines. ConceptDraw PRO allows you to easily create telecommunication network diagrams and then make a PowerPoint Presentation from your network documentation in a few clicks. Telecommunication network diagrams are used to show components and connections in a telecommunications network: how they are interacted between each other and with end-users. The PowerPoint presentation on concept of telecom network can be very informative and helpful. ConceptDraw PRO allows you to make a MS PowerPoint Presentation from your telecommunication network diagrams in a few clicks.Examples of Flowcharts, Org Charts and More
ConceptDraw PRO covers a broad spectrum of business graphics categories and offers at ConceptDraw STORE enormous online collection of pictorial examples and samples for different thematics and application areas. It is a plentiful source of inspiration and wonderful examples of professionally designed diagrams, flowcharts, UML diagrams, organizational charts, databases, ERDs, network diagrams, business charts, different thematic charts, schematics, infographics and plans developed specially for knowledge workers, engineers, managers, businessmen, marketing specialists, analytics, scientists, students, professors, journalists and also for a large number of other people that every day use various diagrams and drawings in their work and life activity. Each of these examples is a real art, all they are well thought-out and designed without efforts with help of powerful tools of ConceptDraw PRO software. ConceptDraw examples display all variety of tasks, possibilities and results that ConceptDraw Product Line lets achieve fast and easy. ConceptDraw is one of the best Visio alternatives for Mac. It open all Visio formats like .vsdx, .vss, .vdx files and allows you to export files to Visio formats.
ConceptDraw Arrows10 Technology
How should diagramming software work? Is it possible to develop a diagram as quickly as the ideas come to you? The innovative ConceptDraw Smart Connectors Technology - This is more than enough versatility to draw any type of diagram with any degree of complexity. Connection points are necessary for diagramming network, flowchart and organizational charts. In ConceptDraw you connect shapes by attaching, or snapping and gluing, connectors to shape connection points.Target Diagram
Target Diagram is a convenient and visual way of presentation information which is popular and widely used in marketing, business and economics. ConceptDraw PRO diagramming and vector drawing software extended with Target and Circular Diagrams solution from the Marketing area of ConceptDraw Solution Park is ideal for fast and easy drawing a Target Diagram.Flow chart Example. Warehouse Flowchart
Warehouse Flowcharts are various diagrams that describe the warehousing and inventory management processes on the warehouses. Typical purposes of Warehouse Flowcharts are evaluating warehouse performance, measuring efficiency of customer service and organizational performance. This type of Workflow diagrams can be used for identifying any disconnection between business activities and business objectives. They are effectively used by warehouse-related people and organizations, manufacturers, wholesalers, exporters, importers, transporters, and others. Standard Warehousing process flow diagram and standard Workflow diagram are used for process identification for further evaluating effectiveness and profitability of overall business process. Use the ConceptDraw PRO vector graphic software extended with Flowcharts solution to design your own professional-looking Workflow diagrams and Flowcharts of any types, including the Warehouse flowchart, Process flow diagrams which depict in details all steps of Warehouse packages flow. Microsoft Visio, designed for Windows users, can’t be opened directly on Mac. But fortunately, there are several Visio alternatives for Mac which will help Mac users to work Visio files. With ConceptDraw PRO, you may open, edit and save files in Visio format.
Marketing and Sales Organization chart. Organization chart Example
The use of Organization Charts is very popular at the fields of marketing and sales. They help to depict in a visual form a lot of information about organization: the company's structure, relationships of positions within an organization in terms of authorities and responsibilities, and company's strategies. All Organizational Charts are constructed from the similar building blocks (rectangles and lines), this makes them easily for interpretation and understanding by all interested people inside and outside of this company, such as shareholders, employees, investors, distributors, suppliers, customers, etc. Organization Charts can be hand-drawn on the paper, however the preferable is to use a special software. ConceptDraw PRO diagramming and vector graphics software extended with useful Organizational Charts solution is ideal for easy representing information and data, and professional drawing Marketing and Sales Organization Chart with any depth of detailing. Organizational structure may differ during the company's development, you can design and compare the charts on each stage.How to Create a Social Media DFD Flowchart
The use of social media in modern conditions helps the companies to be more effective in timely messaging - actively and rapidly response to a customer posts in social media, to find quickly the appropriate response to social media mentions, to save greatly the budget. Many companies even use the social media as a lead tool for promotion. But how to create a Social Media DFD Flowchart, Social Media Response Flowchart or Action Mind Map fast and easy? ConceptDraw PRO vector graphical software and Social Media Response solution included to ConceptDraw Solution Park assist greatly in their creation. This solution improves the quality of content in social media and helps to build an active customer community. The samples and examples included to Social Media Response solution are helpful for social media teams in developing a social media strategy, in refining and organizing the response process, in creation training materials by trainers and consultants for education the social media groups on how to accomplish the most effectiveness in their daily work.Types of Flowcharts
A Flowchart is a graphical representation of process, algorithm, workflow or step-by-step solution of the problem. It shows the steps as boxes of various kinds and connects them by arrows in a defined order depicting a flow. There are twelve main Flowchart types: Basic Flowchart, Business Process Modeling Diagram (BPMN), Cross Functional Flowchart, Data Flow Diagram (DFD), IDEF (Integrated DEFinition) Flowchart, Event-driven Process Chain (EPC) Diagram, Influence Diagram (ID), Swimlane Flowchart, Process Flow Diagram (PFD), Specification and Description Language (SDL) Diagram, Value Stream Mapping, Workflow Diagram. Using the Flowcharts solution from the Diagrams area of ConceptDraw Solution Park you can easy and quickly design a Flowchart of any of these types. This solution offers a lot of special predesigned vector symbols for each of these widely used notations. They will make the drawing process of Flowcharts much easier than ever. Pay also attention for the included collection of ready Flowchart examples, samples and quick-start templates. This is business process improvement tools. If you are looking for MS Visio for your Mac, then you are out of luck, because it hasn't been released yet. However, you can use Visio alternatives that can successfully replace its functions. ConceptDraw PRO is an alternative to MS Visio for Mac that provides powerful features and intuitive user interface for the same.
 Sales Flowcharts
The Sales Flowcharts solution lets you create and display sales process maps, sales process workflows, sales steps, the sales process, and anything else involving sales process management.
HelpDesk
How to Draw a Chemical Process Flow Diagram
Process Flow Diagram widely used in modeling of processes in the chemical industry. A Chemical Process Flow diagram (PFD) is a specialized type of flowchart. With the help of Chemical Process Flow Diagram engineers can easily specify the general scheme of the processes and chemical plant equipment. Chemical Process Flow Diagram displays the real scheme of the chemical process, the relationship between the equipment and the technical characteristics of the process. Chemical Process Flow Diagram illustrates the connections between the basic equipment as well as the overall structure of pipelines and other supporting equipment. The purpose of the PFD is to build the image of the basic idea of the chemical process. ConceptDraw PRO together with its Chemical and Process Engineering solution delivers the possibility to design Chemical Process Flow diagrams. It is designed for chemical industry engineers and designers.HelpDesk
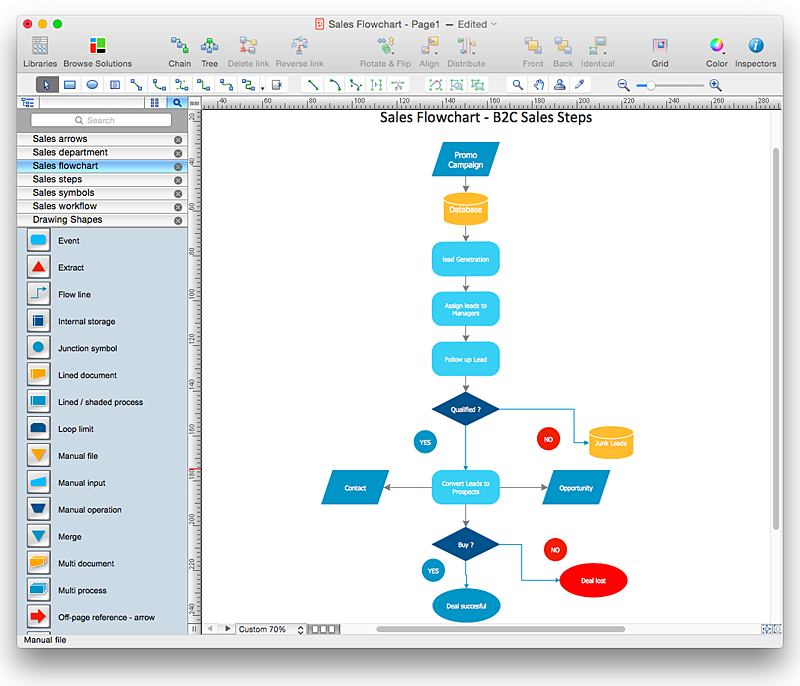
How to Create a Sales Flowchart Using ConceptDraw PRO
A Sales flowchart is a specialized type of flowchart. With the help of a sales flowchart you can visually describe tasks, documents, people responsible for execution at each stage of the sales process. For most commercial organizations, the sales process is inherent to its existence and ability to create profit. Although each company will achieve this aim in its own way, the core selling process remains similar throughout — a potential buyer or prospective customer exchanges money with an organization in return for goods or services. Despite this rather simplistic definition, there exists huge scope as to which approach is taken. Indeed, it is not uncommon for the sales division to be the largest within a corporate structure, employing a team of salespeople, analysts, and the sales managers, who are in charge of sales division operations.The practical applications of sales process flowcharts are numerous and wide ranging. At sales level, you might map the process of customer interact- Flowchart Example: Flow Chart of Marketing Analysis | Marketing ...
- Flowchart Example: Flow Chart of Marketing Analysis | Marketing ...
- Flowchart Example: Flow Chart of Marketing Analysis | Process ...
- Network Marketing Process In Diagram
- Flowchart Example: Flow Chart of Marketing Analysis ...
- Multilevel Marketing Meaning With Diagram
- Flowchart Example: Flow Chart of Marketing Analysis | Pyramid ...
- Schematic Network Marketing Diagram
- Dfd For Online Network Marketing System
- Marketing Diagrams | Computer Network Diagrams | ConceptDraw ...
- Data Flow Diagram Of Multi Level Marketing
- Data Flow Digram Of Networking Marketing
- Marketing Diagrams | Process Flowchart | Flow chart Example ...
- UML Use Case Diagram Example Social Networking Sites Project ...
- Flowchart Example: Flow Chart of Marketing Analysis | Marketing ...
- Dfd Marketing
- Show The Schematic Diagram Characteristics Of Service Marketing
- Multilevel Marketing Block Diagram
- Network Marketing And Telecommunication
- Flowchart Example: Flow Chart of Marketing Analysis | Pyramid ...


