HelpDesk
How to Draw a Gantt Chart
A Gantt chart is intended to provide a visualization of a project schedule. It is developed to help planning, coordinating, and tracking on project tasks implementation. One of the most critical resources for project implementation are time resources. Gantt chart - is one of the most convenient and popular ways of graphical representation of a project tasks progress in conjunction with the corresponding time consumption. Gantt chart's function is to show project tasks completed in progress and to make a project manager sure that project tasks were completed on time. ConceptDraw Office is a clear and easy-to-use tool for project management. It is a very handy visual tool that helps make a project processing clear.HelpDesk
How to Draw a Pareto Chart
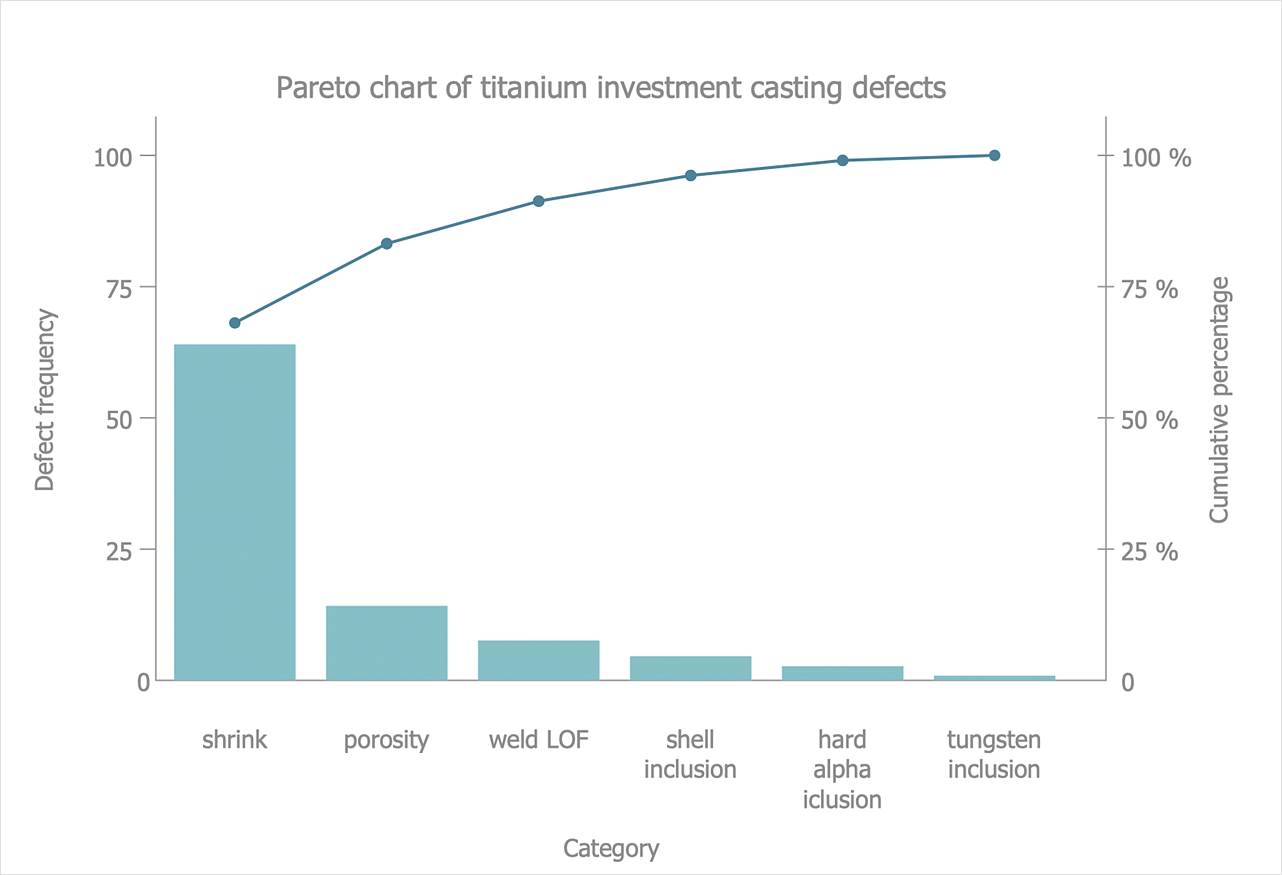
The Seven Basic Tools of Quality were picked as effective visual tool-set for identifying the root cause of quality-related problems within the workplace. Seven Basic Tools of Quality comprise of seven diagrams that are diverse enough to be used to any business troubleshooting scenario, but simple enough that employees of all types can understand and apply them. One of these tools is a Pareto chart. It combines both a line graph and a bar chart, where the bar chart displays data values, and a line represents a total value. Pareto chart is used for quality control to identify the source of the quality problem. ConceptDraw Seven Basic Tools of Quality solution delivers a big set of vector stencil libraries and samples for each quality control diagram, including a Pareto chart.HelpDesk
How To Create a PERT Chart Using PM Easy Solution
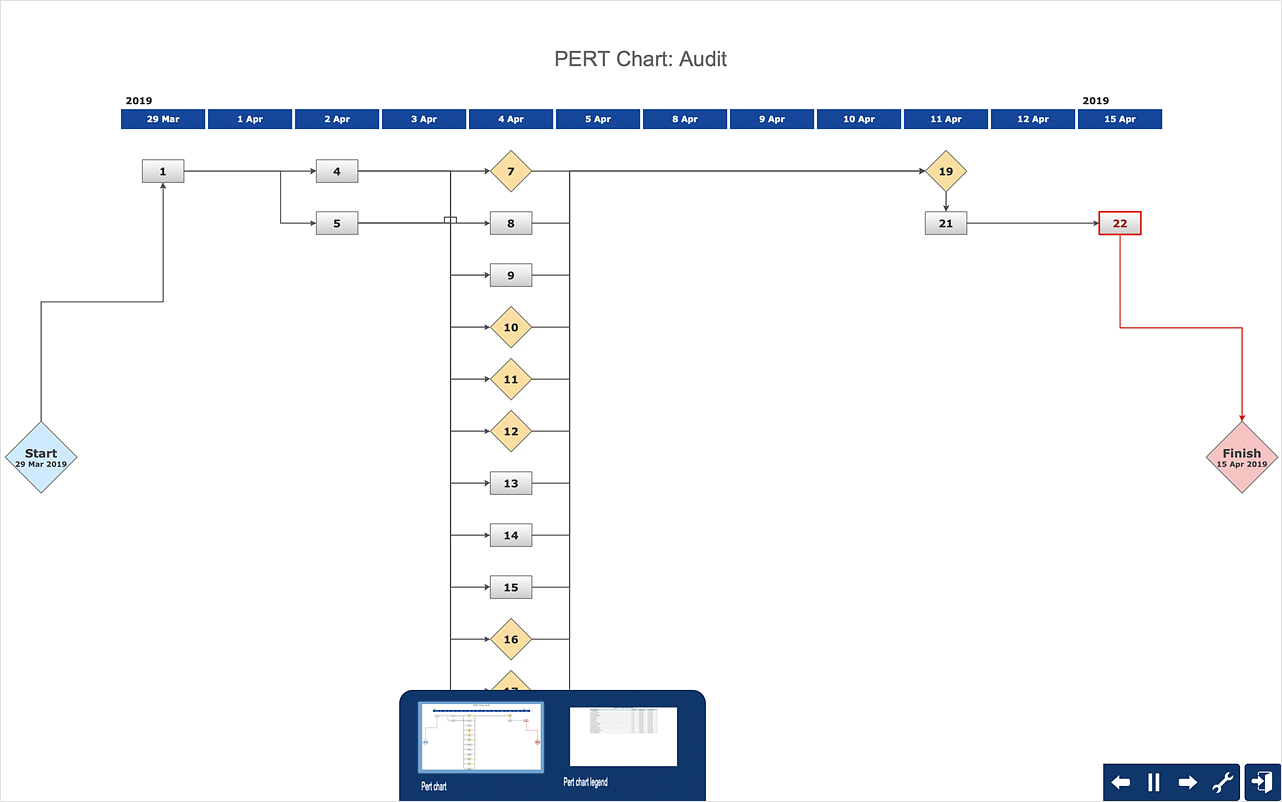
Project Evaluation and Review Technique (PERT) is a method of project tasks evaluation and analysis. PERT - is a method of analyzing the tasks required to complete the project. It includes analysis of the time required to complete each task, as well as the determination of the time required to carry out the whole project. PERT was developed to facilitate the planning of huge and complex projects. PERT is used for very large, complex, and non-standard projects. Technology implies the presence of uncertainty, making it possible to develop a schedule of the project without a precise information on details and time required for all of its components. The most popular part of PERT is a method of the critical path, based on the construction of the network schedule (PERT network diagram). ConceptDraw Office delivers you the best way to create PERT chart for your project using compatibility between ConceptDraw PROJECT and ConceptDraw DIAGRAM.HelpDesk
How to Create a Seating Chart for Wedding or Event
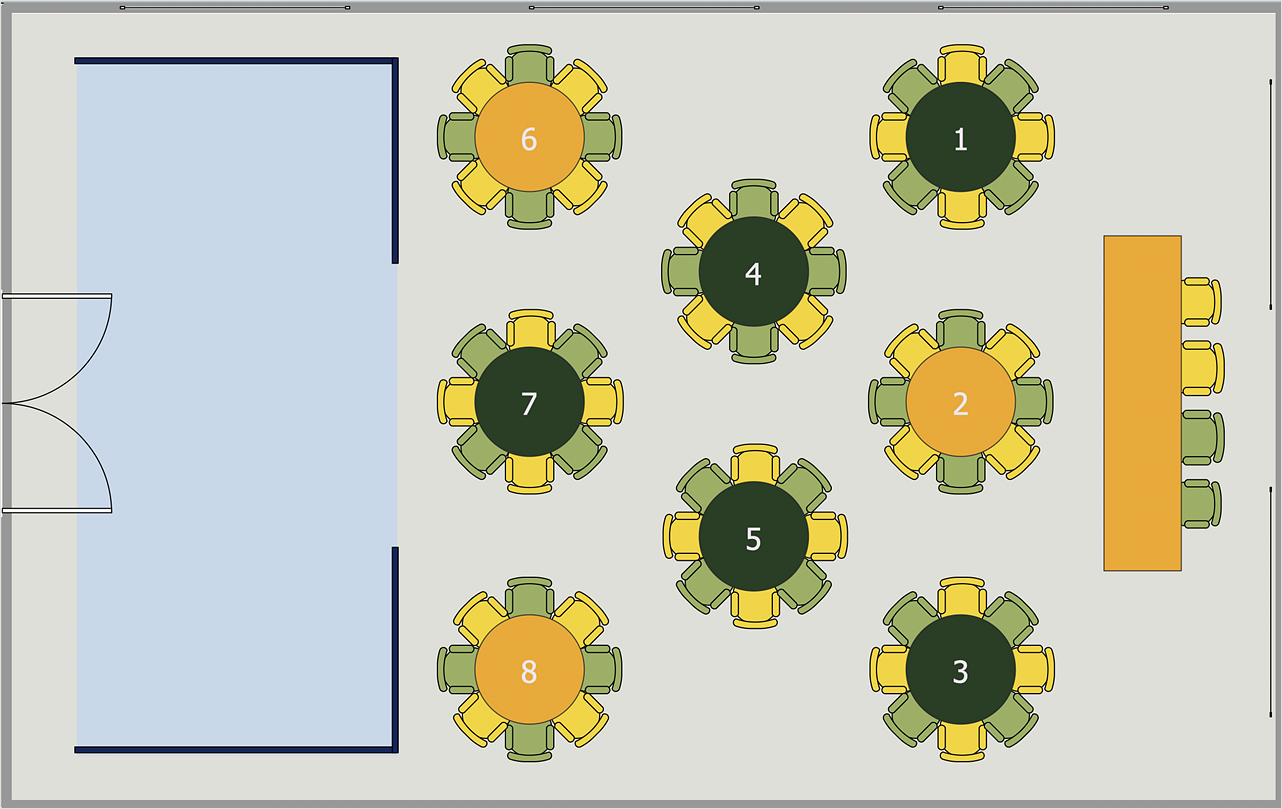
Making the guests invited to a wedding or any other special event feel as comfortable as possible, you necessary to take care of the preparation of the seating arrangements plan. That is why it is important to make a detailed table seating chart that will carefully be positioning any invitee. Making a Seating Chart template with a help of seating chart software is the best way to represent and prepare a seating plan, for event participants and guests. The ability to design different seating plans is delivered by the ConceptDraw Seating Plans solution. Using ConceptDraw DIAGRAM simplifies the complex and cumbersome process of public events organization.- Image Of Balance Diet Chart For Drawing With Label
- Electronics Mechanics Sarkit Simbol Chart Pdf
- Top 5 Android Flow Chart Apps | Simple Drawing Applications for ...
- Flow Chart Of Electronic Component Online Services
- Electronic Schematic Symbols Chart Pdf
- Process Flowchart | Technical Drawing Software | Mechanical ...
- Example Drawing In Electronics Engineering
- How to Draw an Organization Chart | Electrical Drawing Software ...
- Building Drawing Software for Design Seating Plan | Seating Plans ...
- How to Create a Pie Chart | How to Draw the Different Types of Pie ...
- Sequence Diagram For Electronic Shop Management System Project
- Bubble Diagrams | How To Create a Bubble Chart | CAD Drawing ...
- Process Flowchart | How to Draw an Organization Chart | Gym ...
- How to Draw a Pareto Chart Using ConceptDraw PRO | Pareto ...
- Percentage Pie Chart . Pie Chart Examples | Atmosphere air ...
- Process Flowchart | How To use House Electrical Plan Software ...
- Process Flowchart | Process Flow Diagram Symbols | TQM Software ...
- Process Flow Chart | Mechanical Drawing Software | Process ...
- Engineering Drawing Charts Com


