HelpDesk
How to Add a Block Diagram to an MS Word ™ Document
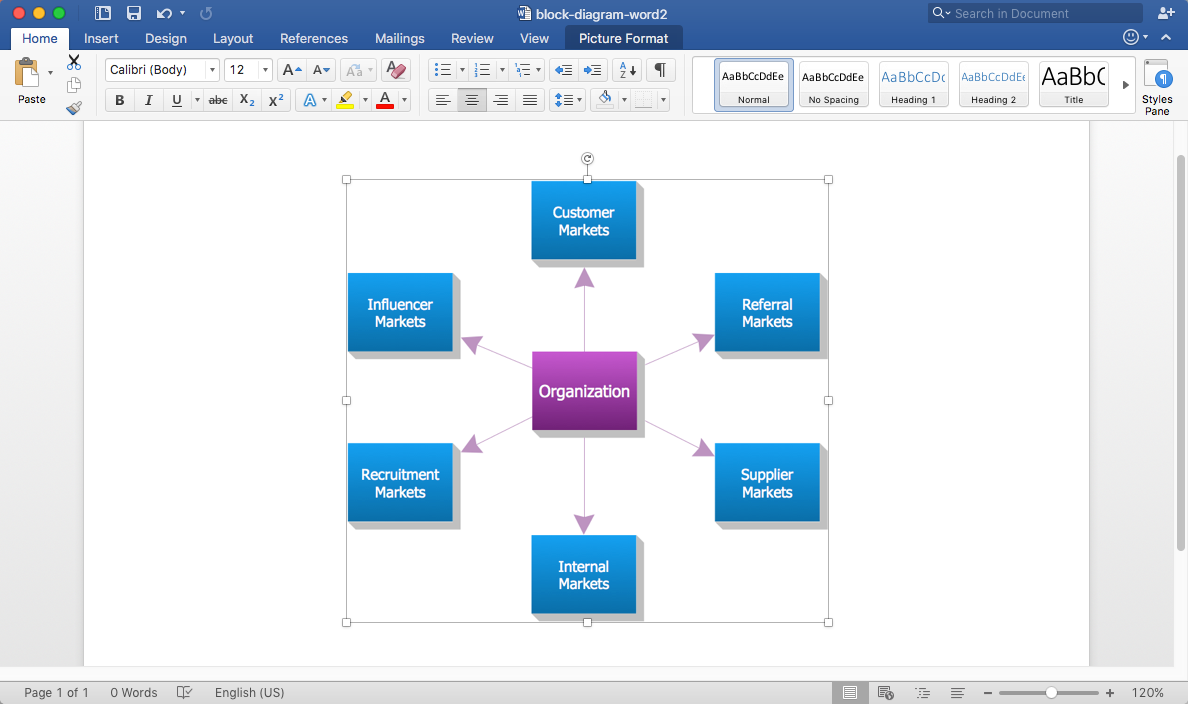
Block diagram consists of graphic blocks. Blocks are connected by lines or arrows. Block diagrams are used to show the relationship between parts of some systems. It can be used for the development of new systems or to improve existing ones. The structure of the block diagram gives a high-level overview of the major components of the system, as well as the important relationships. Using the block diagrams, you can more effectively present the business data contained in your MS Word documents. ConceptDraw DIAGRAM allows you to easily create block diagrams and then insert them into an MS Word document.HelpDesk
How to Add a Network Diagram to MS Word
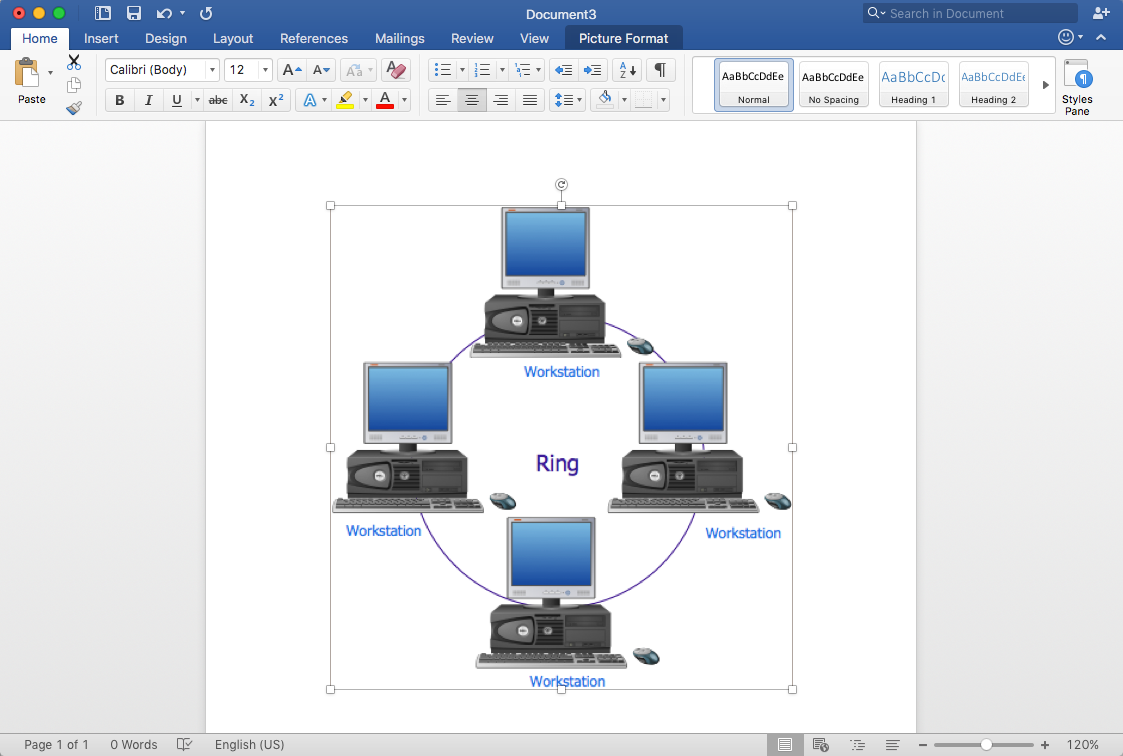
Effective management of the computer network of any size includes the creation and maintenance of the network documentation package. Computer network diagrams may be the part of the network documentation that is often presented as MS Word document. Network diagrams describing the topology of the network and equipment installed in the network, are the essential part of this package. ConceptDraw DIAGRAM provides network administrators with ability to easily create computer network diagrams and then insert them into a MS Word document.How to Create Presentation of Your Project Gantt Chart
During the planning, discussing and execution of a project you may need to prepare a presentation using project views such as the Gantt Chart, Multiproject Dashboard or Resource Usage View. It’s easy do with ConceptDraw PROJECT!HelpDesk
How to Add a Block Diagram to a PowerPoint Presentation
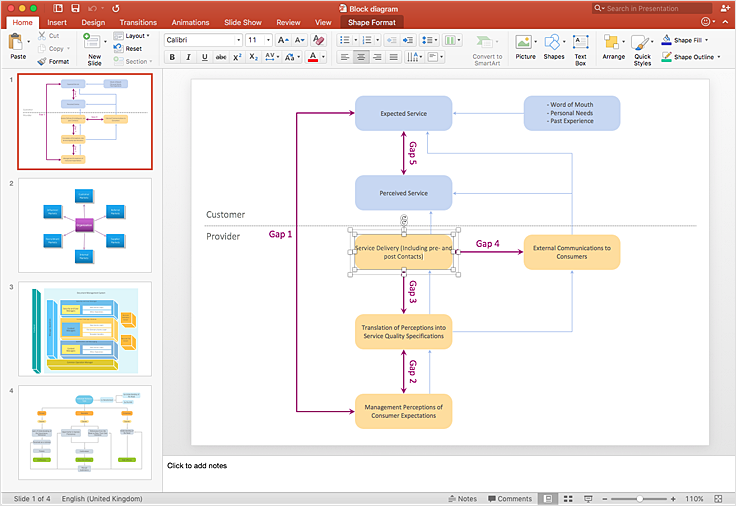
A block diagram is a useful tool both in designing new processes, and in improving existing. A block diagram is a type of chart, which is often used in presentations, because of its universality - the graphic blocks can be applied to many processes.The PowerPoint presentation of major process steps and key process participants can be very informative and helpful. Using ConceptDraw DIAGRAM , you can easily convert a block diagram to MS PowerPoint presentation.Network Diagram Software. LAN Network Diagrams. Physical Office Network Diagrams
Physical LAN Diagrams illustrate the communication schemes of Local Area Networks, the physical network connection of computers and networks arrangement on the small areas - at homes, offices, and other buildings. ConceptDraw DIAGRAM is a perfect network diagramming software with samples and examples of WAN and LAN Diagrams, templates and collection of network components libraries. Computer Network Diagrams Solution for ConceptDraw DIAGRAM Mac and Windows is ideal for IT professionals, network engineers and network designers who need to visualize network architecture, to document LANs physical structure and arrangement, to draw Local Area Network (LAN) diagrams and schematics, WAN diagrams, physical office network diagrams and topologies, wiring drawings, etc. You can design all them easy using the predesigned vector objects of computers and computer network devices, hardware devices, peripheral devices, external digital devices, internet and logical symbols, and many other stencils from the Computer Network Diagrams libraries. ConceptDraw DIAGRAM offers a powerful and easy-to-use solution for those who looking for a Visio alternative for Mac. It is a world-class diagramming platform with dynamic presentation power.
HelpDesk
How to Add a Circle-Spoke Diagram to MS Word Document
ConceptDraw DIAGRAM allows you to easily create various marketing charts, including the circle-spoke diagrams and then insert them into an MS Word document.HelpDesk
How to Add a Bubble Diagram to MS Word
A bubble chart is a diagram in which the data points are replaced with bubbles, and the size of the bubbles represents some additional dimension of the data. A bubble chart does not have the axis. A bubble chart can be used instead of a scatter diagram if the data has three dimensions, each of that containing the set of values. The sizes of the bubbles are determined by the values in the third dimension. Any additional information about the entities beyond their three primary dimensions can be depicted by rendering bubbles in colors and patterns that are selected in a certain way. The legend containing the further information can be added to a bubble diagram. ConceptDraw DIAGRAM allows you to easily create various business management and marketing charts, including bubble diagrams and then add them to a MS Word document.HelpDesk
How to Add a Wireless Network Diagram to a PowerPoint Presentation
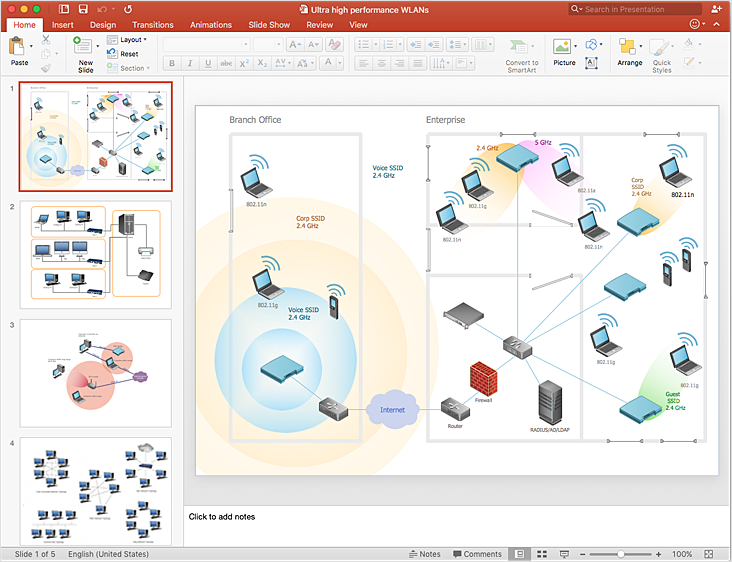
The PowerPoint presentation of the wireless network can be very informative. ConceptDraw DIAGRAM allows you to easily create wireless network diagrams and then make a PowerPoint Presentation from your diagrams in a single click.- How To Draw Block Diagram In Microsoft Powerpoint
- How To Draw Block Chart In Ms Powerpoint
- How to Add a Block Diagram to a MS Word ™ Document Using ...
- Microsoft Office Gantt Chart Template
- How to Add a Bubble Diagram to a MS Word Document Using ...
- Draw Flowcharts With Word And Powerpoint
- How To Draw Block Diagram For Feedback Loop In Microsoft Office
- How to Add a Bubble Diagram to a PowerPoint Presentation Using ...
- How to Add a Bubble Diagram to a MS Word Document Using ...
- Microsoft Office Org Chart 2016
