How to Draw an Organization Chart
An Organizational chart is a type of diagram which visually displays the structure of an organization, relationships and relative ranks of the organization′s parts and positions. Organizational chart is constructed as an hierarchical structure, in the form of tree. How to Draw an Organization Chart the most easy and quickly? The Organizational Charts solution, innovative Tree Auto-connection mode and ConceptDraw Arrows10 Technology included in ConceptDraw DIAGRAM software are powerful drawing tools that change the way of diagrams production. Arrows10 Technology provides smart behavior for the connectors, and so quick and precise placement when drawing, and lets easy make the changes and automatic rearrangement. It helps to make the process of drawing diagrams more efficient, easier and faster. Now, you don′t need to think on how to connect or place the objects, you can concentrate fully on what to draw. See obligatory the helpful video tutorial about creation the Organization Charts and orgchart professional presentations with ConceptDraw products.HelpDesk
How to Draw a Gantt Chart
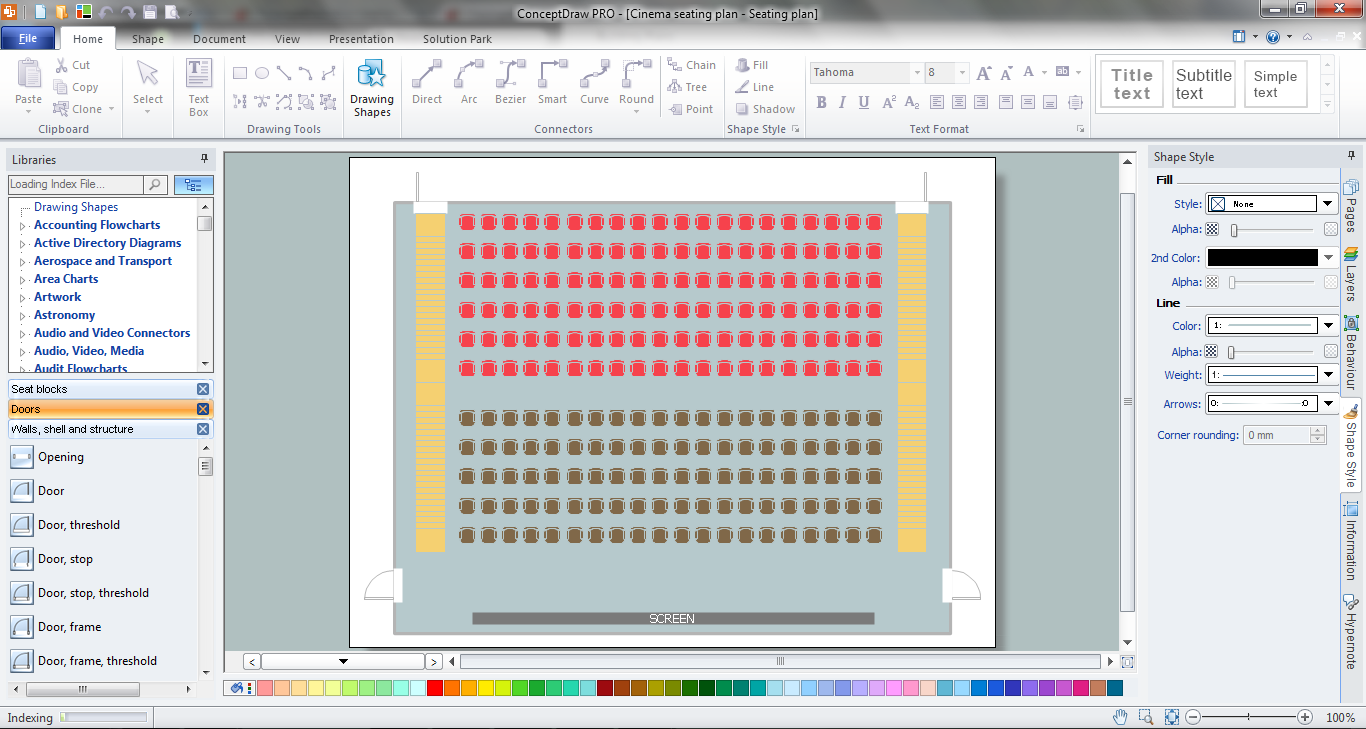
A Gantt chart is intended to provide a visualization of a project schedule. It is developed to help planning, coordinating, and tracking on project tasks implementation. One of the most critical resources for project implementation are time resources. Gantt chart - is one of the most convenient and popular ways of graphical representation of a project tasks progress in conjunction with the corresponding time consumption. Gantt chart's function is to show project tasks completed in progress and to make a project manager sure that project tasks were completed on time. ConceptDraw Office is a clear and easy-to-use tool for project management. It is a very handy visual tool that helps make a project processing clear.Seating Chart Template Free
You need design the seating chart? The simple way is to use the specialized software. ConceptDraw DIAGRAM diagramming and vector drawing software extended with Seating Plans solution from the Building Plans area with powerful drawing tools, samples, seating chart template free will be ideal for you.HelpDesk
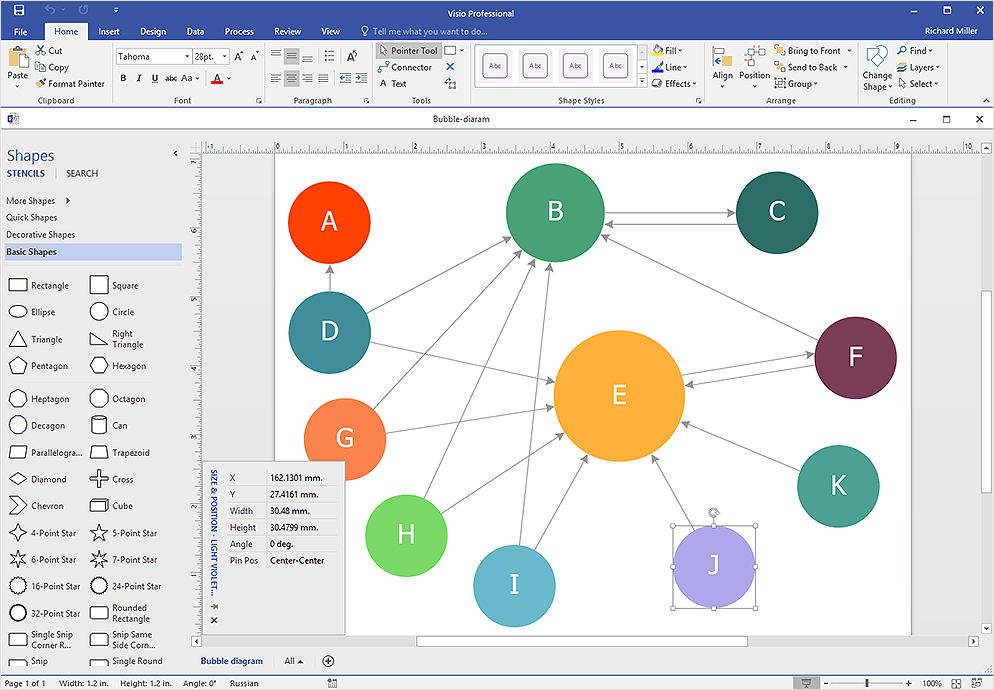
How To Create Visio Bubble Chart
ConceptDraw DIAGRAM allows you to easily create business charts and diagrams of any complexity, including the bubbles diagram and then make a MS Visio file from your diagram in a few simple steps.
 Organizational Charts
Organizational Charts solution extends ConceptDraw DIAGRAM software with samples, templates and library of vector stencils for drawing the org charts.
ConceptDraw DIAGRAM Compatibility with MS Visio
The powerful diagramming and business graphics tools are now not exception, but the norm for today’s business, which develop in incredibly quick temp. But with the abundance of powerful business diagramming applications it is important to provide their compatibility for effective exchange the information between the colleagues and other people who maybe use different software in their work. During many years Microsoft Visio™ was standard file format for the business and now many people need the visual communication software tools that can read the Visio format files and also export to Visio format. The powerful diagramming and vector drawing software ConceptDraw DIAGRAM is ideal from the point of view of compatibility with MS Visio. Any ConceptDraw DIAGRAM user who have the colleagues that use MS Visio or any who migrates from Visio to ConceptDraw DIAGRAM , will not have any problems. The VSDX (Visio′s open XML file format) and VDX formatted files can be easily imported and exported by ConceptDraw DIAGRAM , you can see video about this possibility.- Org Chart Microsoft Office
- How To Make An Organizational Chart In Microsoft Office
- What Microsoft Office Product Has An Org Chart
- An Org Chart Using Ms Office
- Microsoft Office Org Chart 2016
- Microsoft Office Gantt Chart Template
- Office Layout Plans | Microsoft Office Layout Template
- How To Draw Block Diagram For Feedback Loop In Microsoft Office
- How To Draw Organisational Chart In Microsoft Word
- Microsoft Project Charts


