Examples of Flowcharts, Org Charts and More


Activity Network Diagram Method

Activity Network (PERT) Chart

PERT Chart Software

How to Discover Critical Path on a Gantt Chart

Activity on Node Network Diagramming Tool

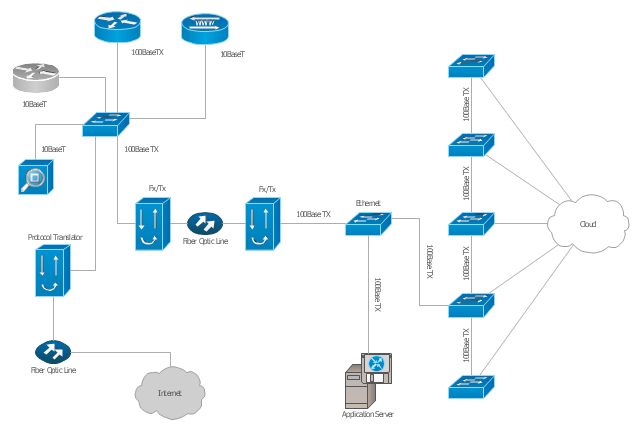
"A computer network diagram is a schematic depicting the nodes and connections amongst nodes in a computer network or, more generally, any telecommunications network. ...
Depending on whether the diagram is intended for formal or informal use, certain details may be lacking and must be determined from context. ...
At different scales diagrams may represent various levels of network granularity. At the LAN level, individual nodes may represent individual physical devices, such as hubs or file servers, while at the WAN level, individual nodes may represent entire cities. In addition, when the scope of a diagram crosses the common LAN/ MAN/ WAN boundaries, representative hypothetical devices may be depicted instead of showing all actually existing nodes." [Computer network diagram. Wikipedia]
The Cisco computer network diagram example "Network organization chart" was created using the ConceptDraw PRO diagramming and vector drawing software extended with the Cisco Network Diagrams solution from the Computer and Networks area of ConceptDraw Solution Park.
Cisco network diagram
Daily Schedule Chart

 Logistics Flow Charts
Logistics Flow Charts solution extends ConceptDraw DIAGRAM functionality with opportunities of powerful logistics management software. It provides large collection of predesigned vector logistic symbols, pictograms, objects and clipart to help you design with pleasure Logistics flow chart, Logistics process flow diagram, Inventory flow chart, Warehouse flowchart, Warehouse management flow chart, Inventory control flowchart, or any other Logistics diagram. Use this solution for logistics planning, to reflect logistics activities and processes of an enterprise or firm, to depict the company's supply chains, to demonstrate the ways of enhancing the economic stability on the market, to realize logistics reforms and effective products' promotion.
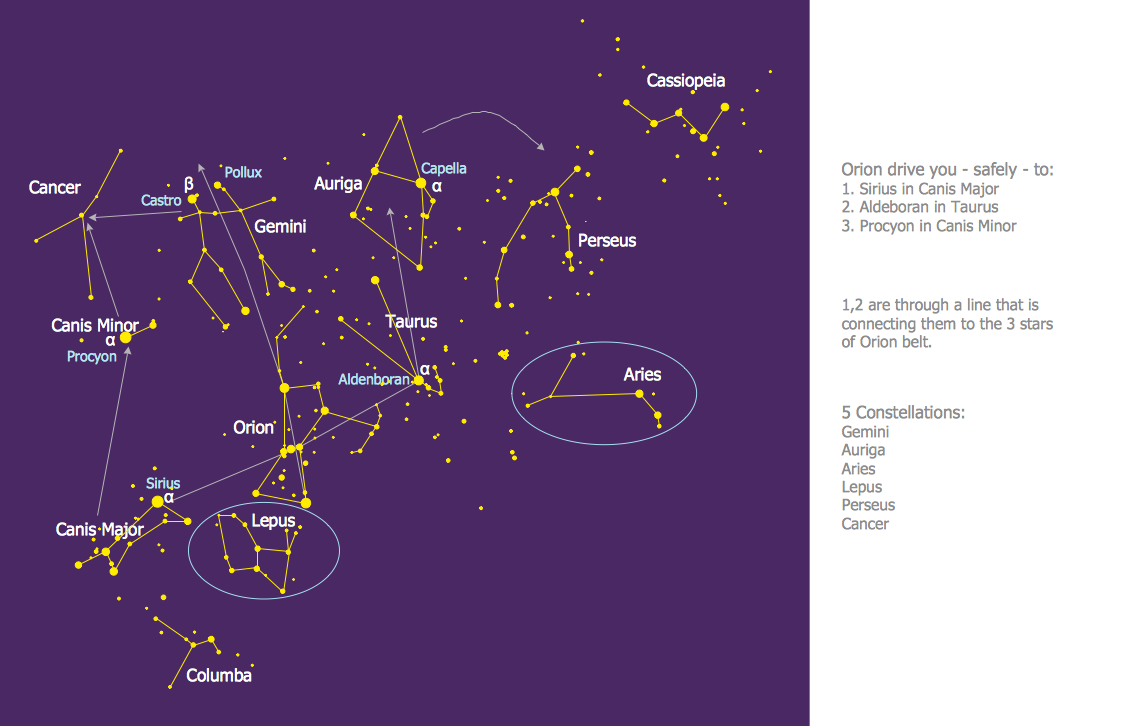
Constellation Chart
Cisco Network Examples and Templates
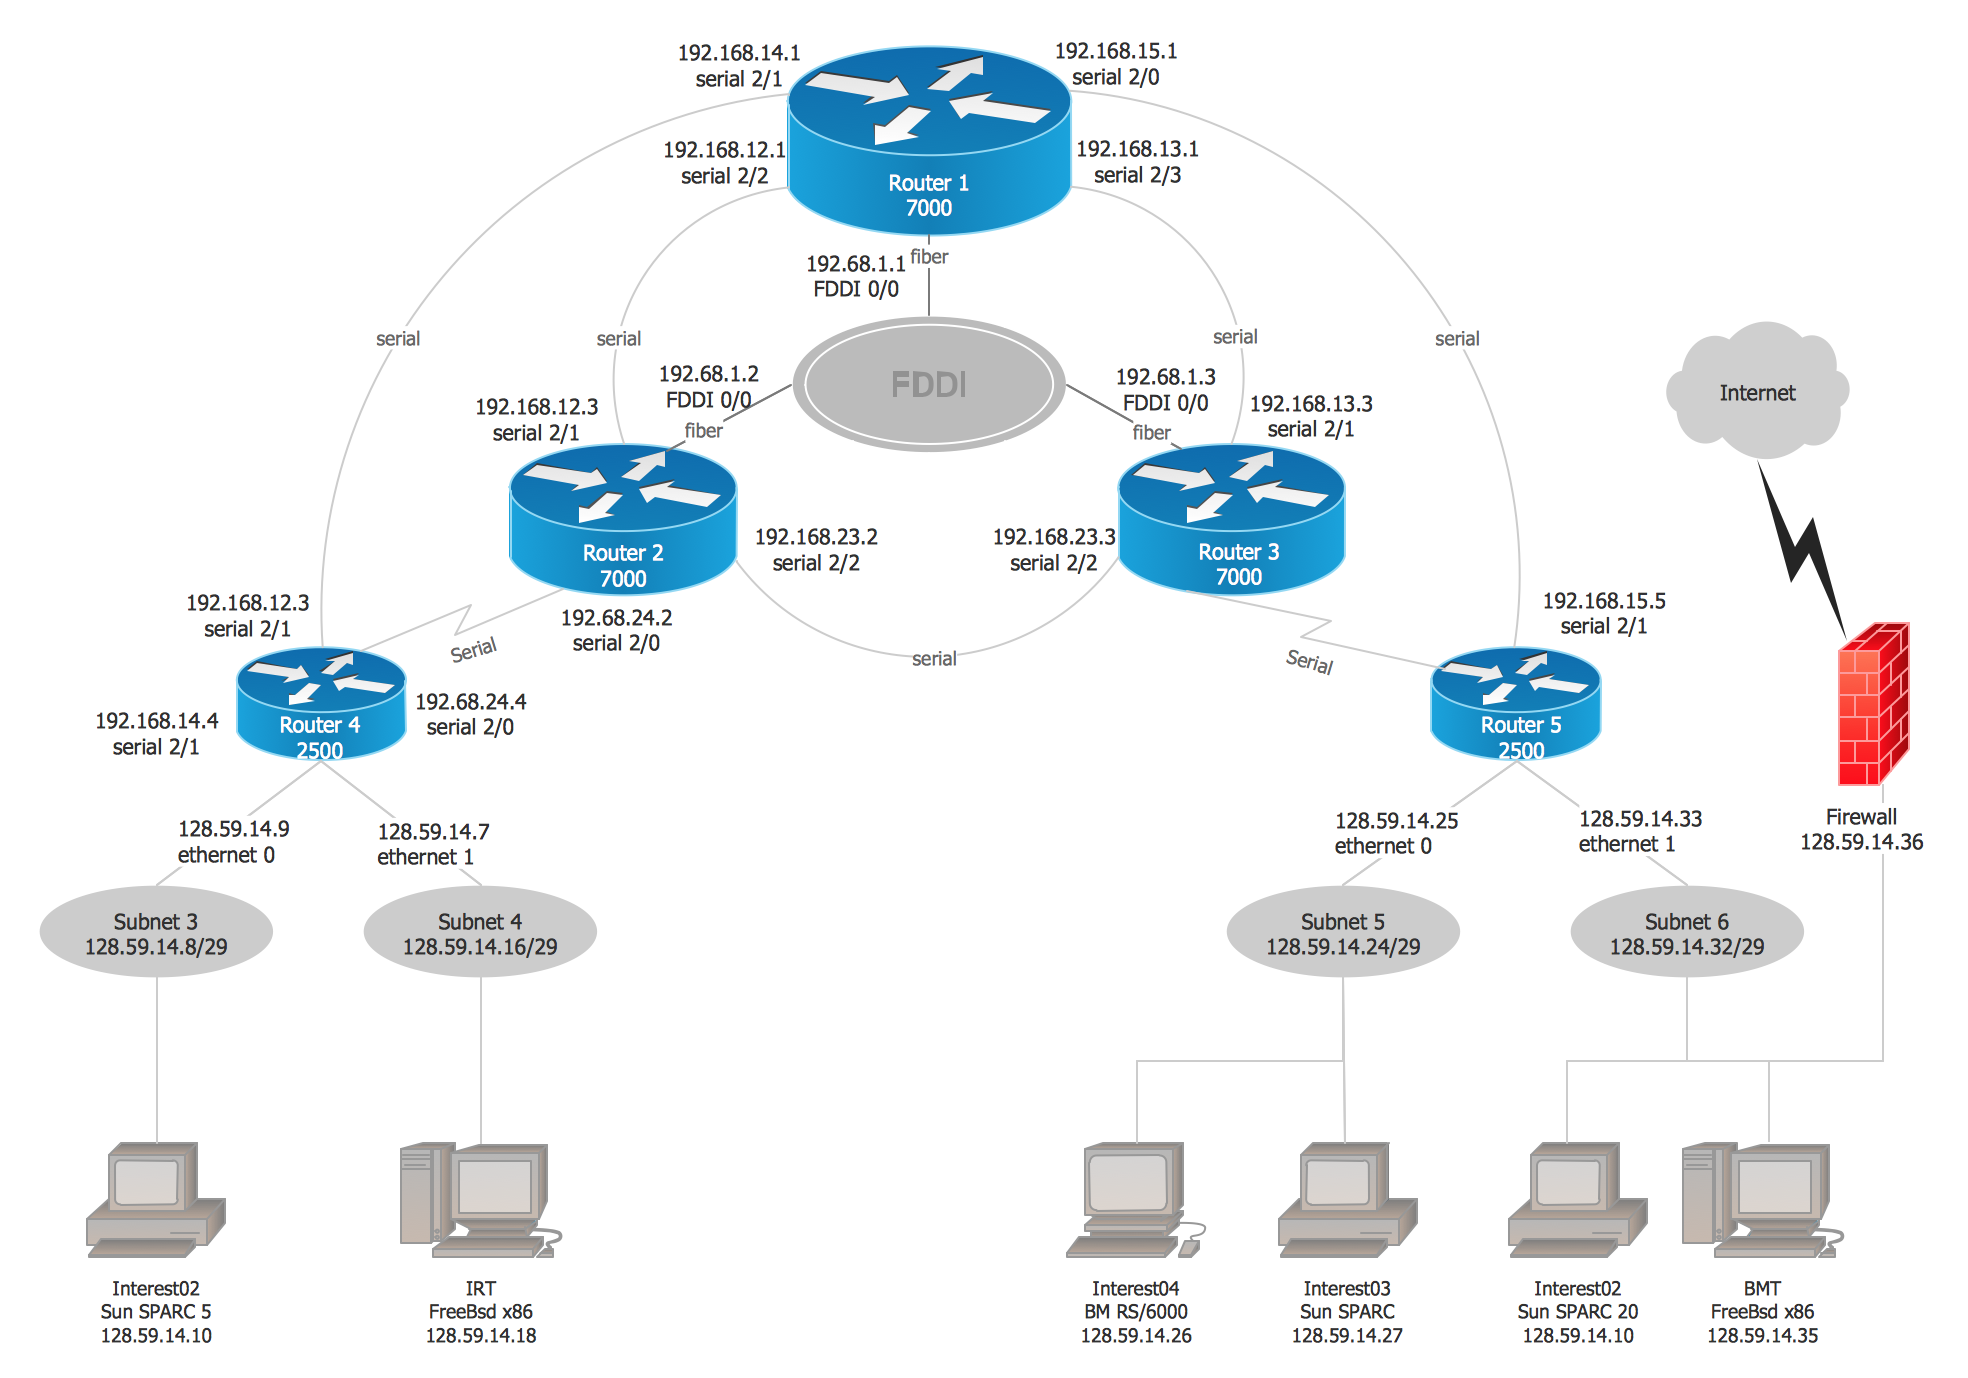
Cisco Network Templates


"A computer network diagram is a schematic depicting the nodes and connections amongst nodes in a computer network or, more generally, any telecommunications network. ...
Depending on whether the diagram is intended for formal or informal use, certain details may be lacking and must be determined from context. ...
At different scales diagrams may represent various levels of network granularity. At the LAN level, individual nodes may represent individual physical devices, such as hubs or file servers, while at the WAN level, individual nodes may represent entire cities. In addition, when the scope of a diagram crosses the common LAN/ MAN/ WAN boundaries, representative hypothetical devices may be depicted instead of showing all actually existing nodes." [Computer network diagram. Wikipedia]
The Cisco computer network diagram example "Network organization chart" was created using the ConceptDraw PRO diagramming and vector drawing software extended with the Cisco Network Diagrams solution from the Computer and Networks area of ConceptDraw Solution Park.
Depending on whether the diagram is intended for formal or informal use, certain details may be lacking and must be determined from context. ...
At different scales diagrams may represent various levels of network granularity. At the LAN level, individual nodes may represent individual physical devices, such as hubs or file servers, while at the WAN level, individual nodes may represent entire cities. In addition, when the scope of a diagram crosses the common LAN/ MAN/ WAN boundaries, representative hypothetical devices may be depicted instead of showing all actually existing nodes." [Computer network diagram. Wikipedia]
The Cisco computer network diagram example "Network organization chart" was created using the ConceptDraw PRO diagramming and vector drawing software extended with the Cisco Network Diagrams solution from the Computer and Networks area of ConceptDraw Solution Park.
Cisco network diagram
Star Network Topology


How to Create Presentation of Your Project Gantt Chart

- Activity Network (PERT) Chart | PERT Chart Software | Program ...
- Activity Network Diagram Method | How to Create Presentation of ...
- Prepare A Chart For Distribution Network For Different Products
- Examples of Flowcharts, Org Charts and More | Star Network ...
- Process Flowchart | Activity Network (PERT) Chart | Flow chart ...
- Activity Network (PERT) Chart | Activity Network Diagram Method ...
- Examples of Flowcharts, Org Charts and More | Local area network ...
- Chart Network Star Topology
- Telecommunication Network Chart
- Flow chart Example. Warehouse Flowchart | Activity Network ...
- Activity Network (PERT) Chart | How to Discover Critical Path on a ...
- Activity Network Diagram Method | Network Diagramming Software ...
- Activity Network Diagram Method | Activity Network (PERT) Chart ...
- Network Security | Gantt chart examples | ConceptDraw PRO ...
- Activity Network Chart In Softwrae Project Management
- Flow Chart The Simple Computer Network Systems
- Network Security | Network Security Devices | Column Chart ...
- PERT Chart Software | Activity Network Diagram Method | PM Easy ...
- Cisco Network Design | Cisco Network Templates | Network ...
- Organizational Chart Templates | Network Diagram Examples ...