 Cisco Network Diagrams
Cisco Network Diagrams solution extends ConceptDraw DIAGRAM with the best characteristics of network diagramming software. Included samples, templates and libraries of built-in standardized vector Cisco network icons and Cisco symbols of computers, network devices, network appliances and other Cisco network equipment will help network engineers, network designers, network and system administrators, as well as other IT professionals and corporate IT departments to diagram efficiently the network infrastructure, to visualize computer networks topologies, to design Cisco computer networks, and to create professional-looking Cisco Computer network diagrams, Cisco network designs and schematics, Network maps, and Network topology diagrams in minutes.
HelpDesk
How to Create a Timeline Diagram
A Timeline is a chart which displays a project plan schedule in chronological order. A Timeline is used in project management to depict project milestones and visualize project phases and show project progress. The graphic form of a timeline makes it easy to understand critical project milestones, such as the progress of a project schedule. Timelines are particularly useful for project scheduling or project management when accompanied with a Gantt chart. It captures the main of what the project will accomplish and how it will be done. making a project timeline is one of the most important skills a project manager needs have. Making comprehensive, accurate timelines allows you getting every project off in the best way. ConceptDraw DIAGRAM allows you to draw a timeline chart using a special library.
 Area Charts
Area Charts are used to display the cumulative totals over time using numbers or percentages; or to show trends over time among related attributes. The Area Chart is effective when comparing two or more quantities. Each series of data is typically represented with a different color, the use of color transparency in an object’s transparency shows overlapped areas and smaller areas hidden behind larger areas.
 ConceptDraw Solution Park
ConceptDraw Solution Park collects graphic extensions, examples and learning materials
HelpDesk
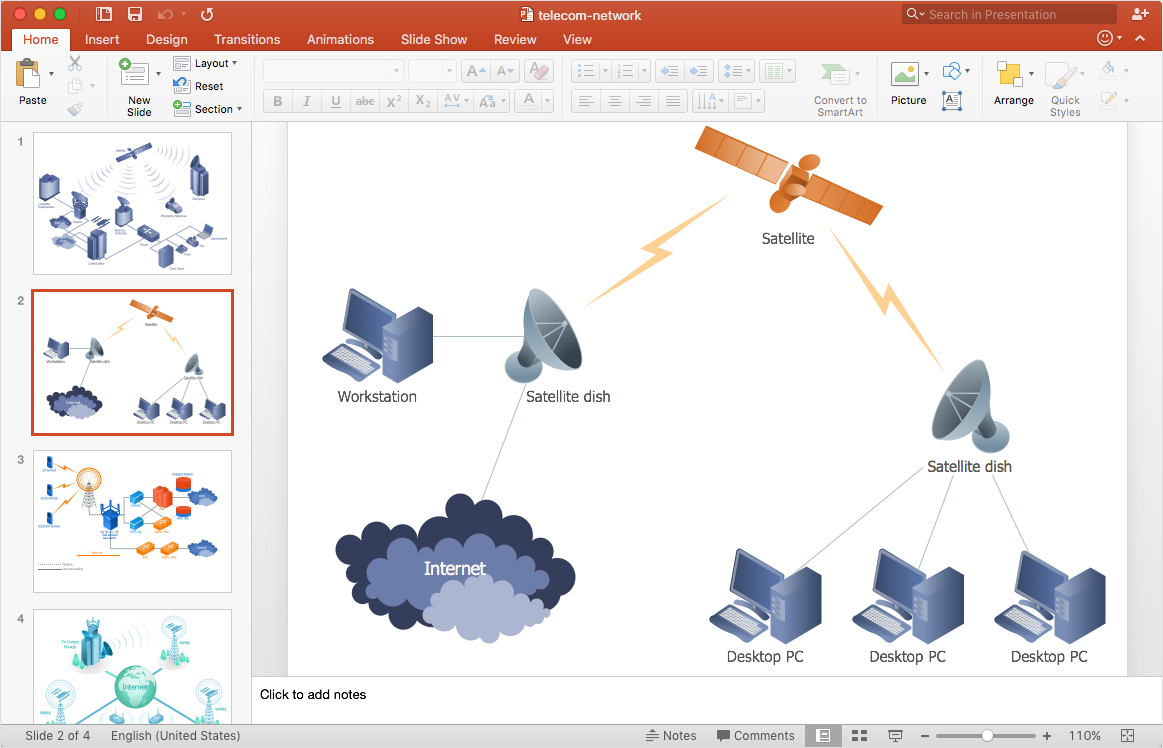
How to Add a Telecommunication Network Diagram to a PowerPoint Presentation
Telecommunication network diagram represents a system consisting of computers, servers, telecommunication devices, switches, satellites, wireless transmitters, antennas, cables, etc., that link a set of remote nodes. It also describes a telephone exchange, that connects calls between landlines. ConceptDraw DIAGRAM allows you to easily create telecommunication network diagrams and then make a PowerPoint Presentation from your network documentation in a few clicks. Telecommunication network diagrams are used to show components and connections in a telecommunications network: how they are interacted between each other and with end-users. The PowerPoint presentation on a conception of telecom network can be very informative and helpful. ConceptDraw DIAGRAM allows you to make an MS PowerPoint Presentation from your telecommunication network diagrams in a few clicks.HelpDesk
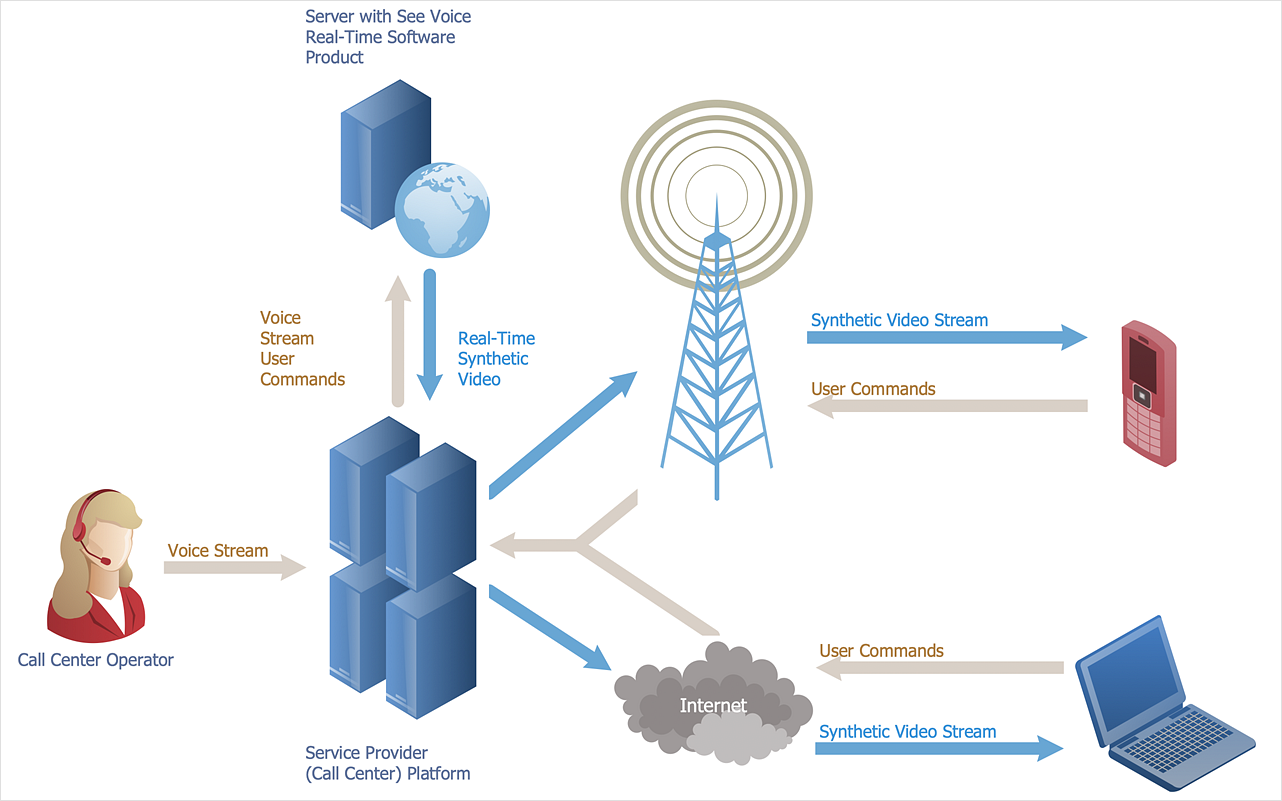
How to Create a Telecommunication Network Diagram
Telecommunication network diagram displays components and connections in a telecommunication network: how they are interacted between each other and with end-users. Telecommunication network diagrams usually created by system engineers for planning telecom networks. Also, they may be useful for a network management. Telecom network diagram visualizes the level of security and user access to certain equipment and data within a current network. Telecom network diagram can be used to identify weak points of an entire network or a part of it. ConceptDraw DIAGRAM allows you to draw a simple and clear Telecommunication Network diagrams.HelpDesk
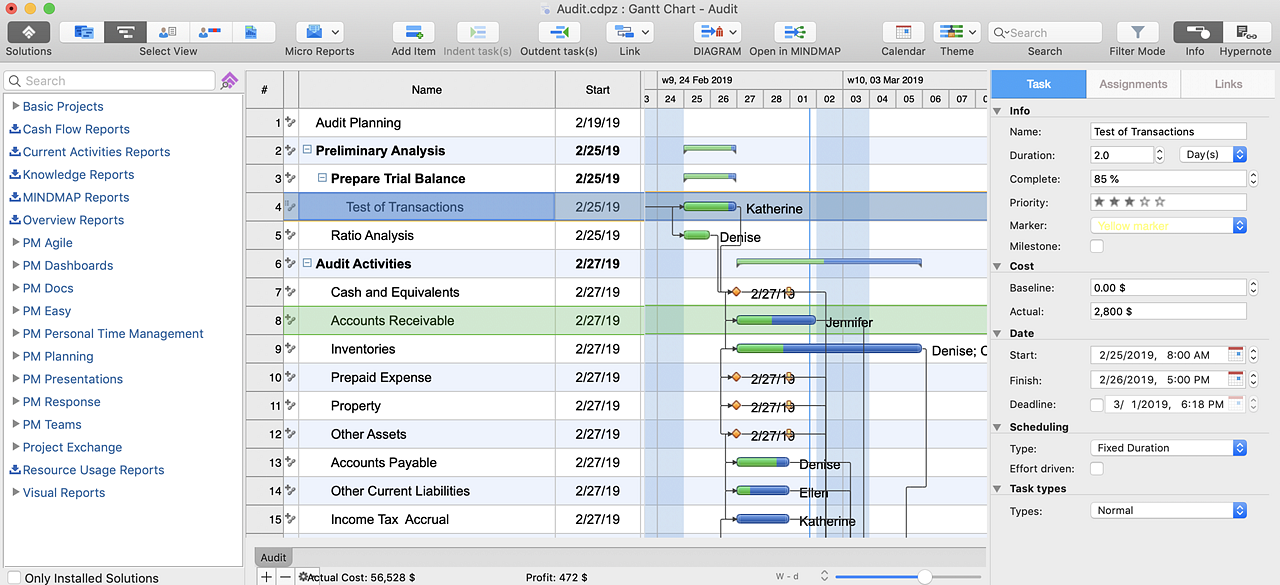
How to Quickly Make a Project from a Mind Map
ConceptDraw MINDMAP allows you to view your mind map as a Gantt chart. You can do this by opening your map in ConceptDraw PROJECT. It is possible to proceed with the same file in both ConceptDraw MINDMAP and ConceptDraw PROJECT.HelpDesk
How to Make Network Diagram
ConceptDraw DIAGRAM allows you to represent and communicate network architecture, topology, and design to engineers, stakeholders, and end-users.In searching of alternative to MS Visio for MAC and PC with ConceptDraw DIAGRAM
Undoubtedly MS Visio is a powerful and multifunctional tool, but however at times occur the instances, when it turns unable of meeting certain users' requirements. At this cases you may need to use an alternative program software, preferably it will be simple, convenient, and at the same time powerful and professional. In searching the alternative to MS Visio for MAC and PC we recommend you to pay attention for ConceptDraw DIAGRAM software, which was developed to satisfy all your drawing needs and requirements. It is a fully-functioned alternative product to MS Visio for both platforms. ConceptDraw DIAGRAM software has many advantages, the main among them are the cross-platform compatibility, a reasonable price, widespread ConceptDraw Solution Park with huge variety of different solutions that offer numerous libraries of specialized vector objects, useful examples, samples, and quick-start templates, extensive import / export capabilities, built-in script language, MS Visio support and certainly free technical support.HelpDesk
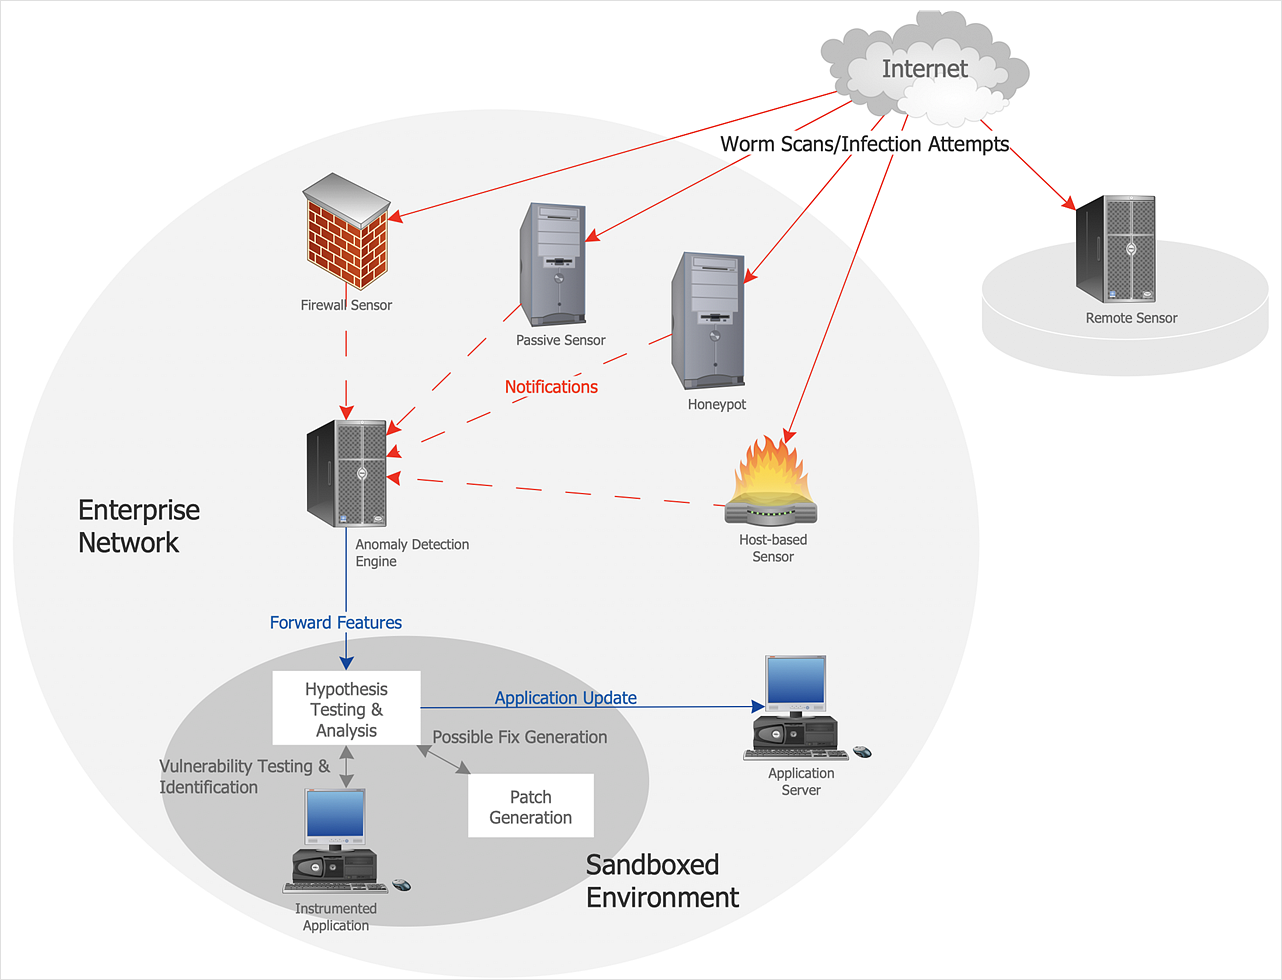
How to Create a Network Security Diagram
Network security requires constant work and attention to details. Each user, whether an individual or organization, owns a piece of information, considered to be valuable. The enforcement of network security, whether it be local network security, or wireless network security is the core for creating the secure environment of the daily working processes. Network security is accomplished through hardware and software. The network security system must be sophisticated and modern inside, but simple and understandable for the user. The visual scheme of a security system can be presented in the form of a Network Security diagram. ConceptDraw DIAGRAM provides the toolkit for network security system visualization with its Network Security Diagram solution.
 Telecommunication Network Diagrams
Telecommunication Network Diagrams solution extends ConceptDraw DIAGRAM software with samples, templates, and great collection of vector stencils to help the specialists in a field of networks and telecommunications, as well as other users to create Computer systems networking and Telecommunication network diagrams for various fields, to organize the work of call centers, to design the GPRS networks and GPS navigational systems, mobile, satellite and hybrid communication networks, to construct the mobile TV networks and wireless broadband networks.
- Chart On Networking Concept Wan
- Activity Network Chart In Softwrae Project Management
- Informative Presentation On Basic Networking Concepts
- Flow Charts Of Basic Networking Concepts
- Network Layout Floor Plans | Network Components | Network ...
- Telecommunication Network Diagrams | Wireless Networks ...
- Computer Networking Concept Chart
- Network Layout Floor Plans | Examples of Flowcharts, Org Charts ...
- Pics Networking Related Chart Of Computer
- Examples of Flowcharts, Org Charts and More | Network diagrams ...
- Network diagrams with ConceptDraw PRO | Local area network ...
- Telecommunication Network Chart
- Value Stream Mapping | Concept Maps | Computer Network ...
- Computer Network Diagrams | IDEF9 Standard | Draw The ...
- How To Use Skype for Business | Hierarchical Network Topology ...
- Architecture Concept Diagram Software
- Mesh Network Topology Diagram | Activity Network Diagram Method ...
- Network diagrams with ConceptDraw PRO | Cisco Design ...
- Evolution of the population - Line chart | Line Chart Examples ...
- Activity Network Diagram Method | Gant Chart in Project ...


