HelpDesk
How to Create a Bank ATM Use Case Diagram

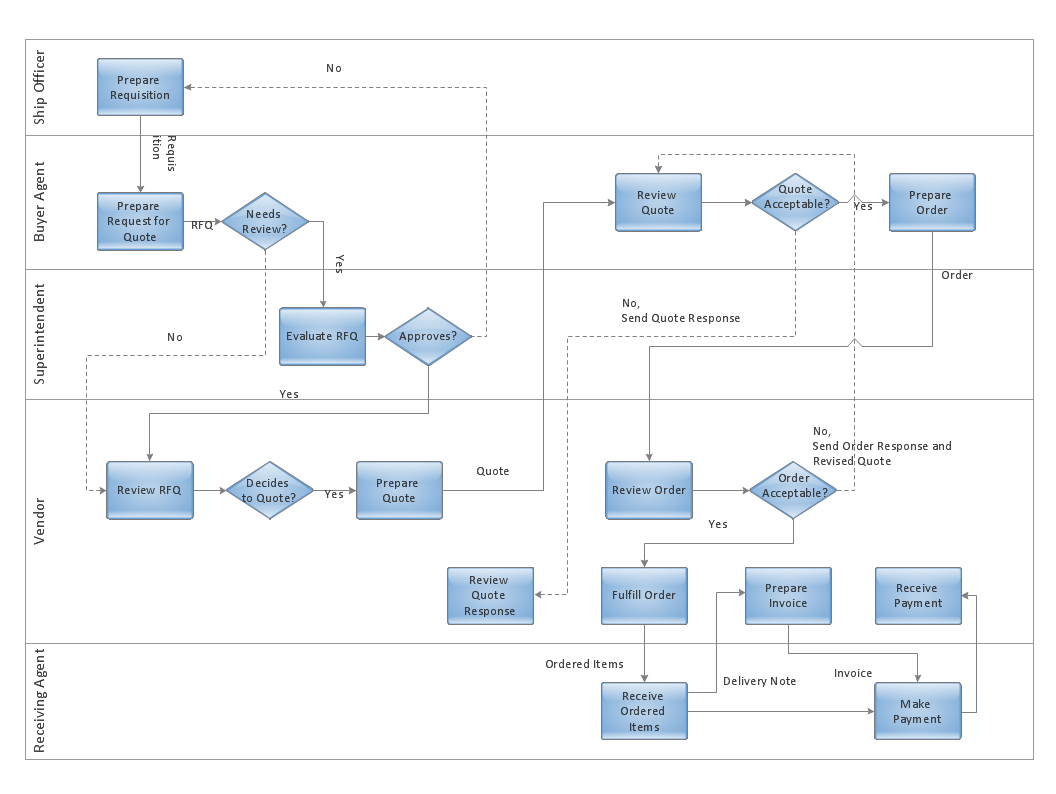
Accounting Flowchart Purchasing Receiving Payable and Payment

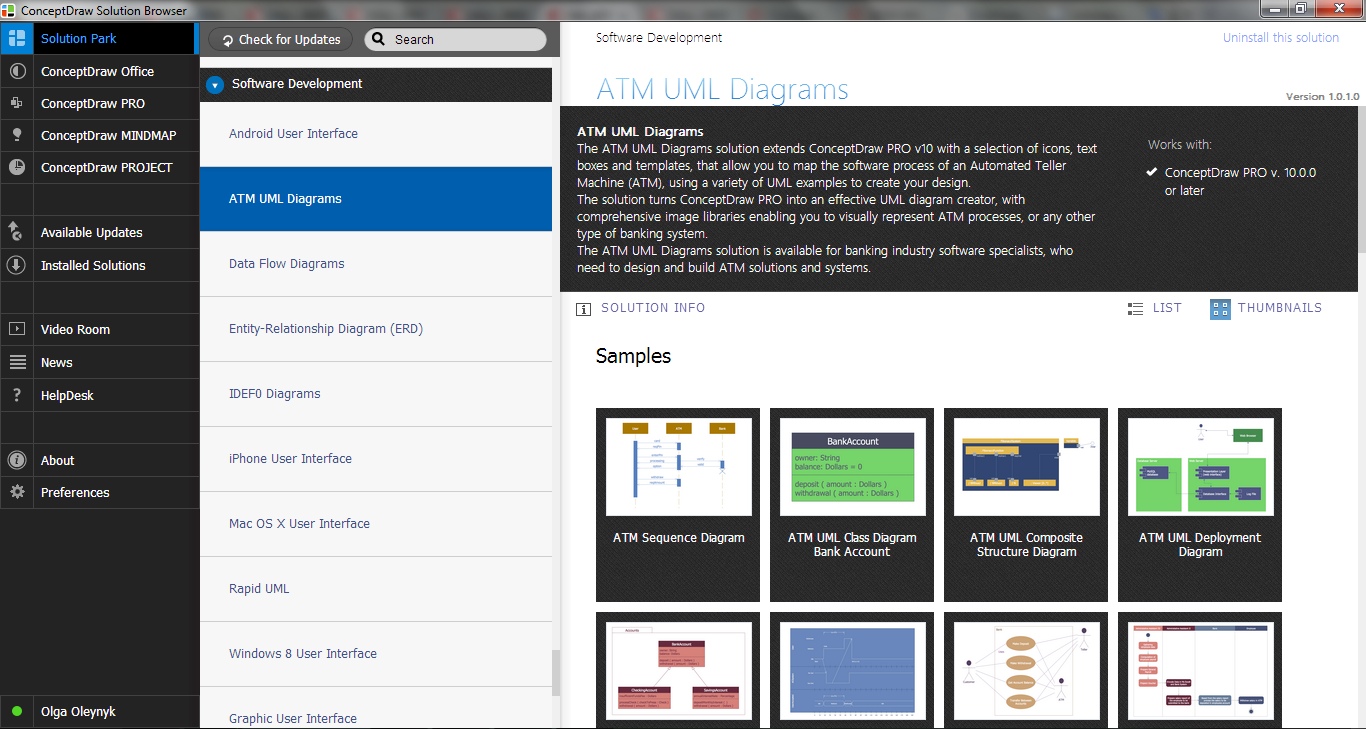
 ATM UML Diagrams
The ATM UML Diagrams solution lets you create ATM solutions and UML examples. Use ConceptDraw DIAGRAM as a UML diagram creator to visualize a banking system.
Formalization and Verification of Event-driven Process chain
Work Flow Chart

Cross-Functional Flowcharts in ConceptDraw
Financial Trade UML Use Case Diagram Example

Yourdon and Coad Diagram

Account Flowchart Stockbridge System. Flowchart Examples

DFD Library System

ATM Solutions
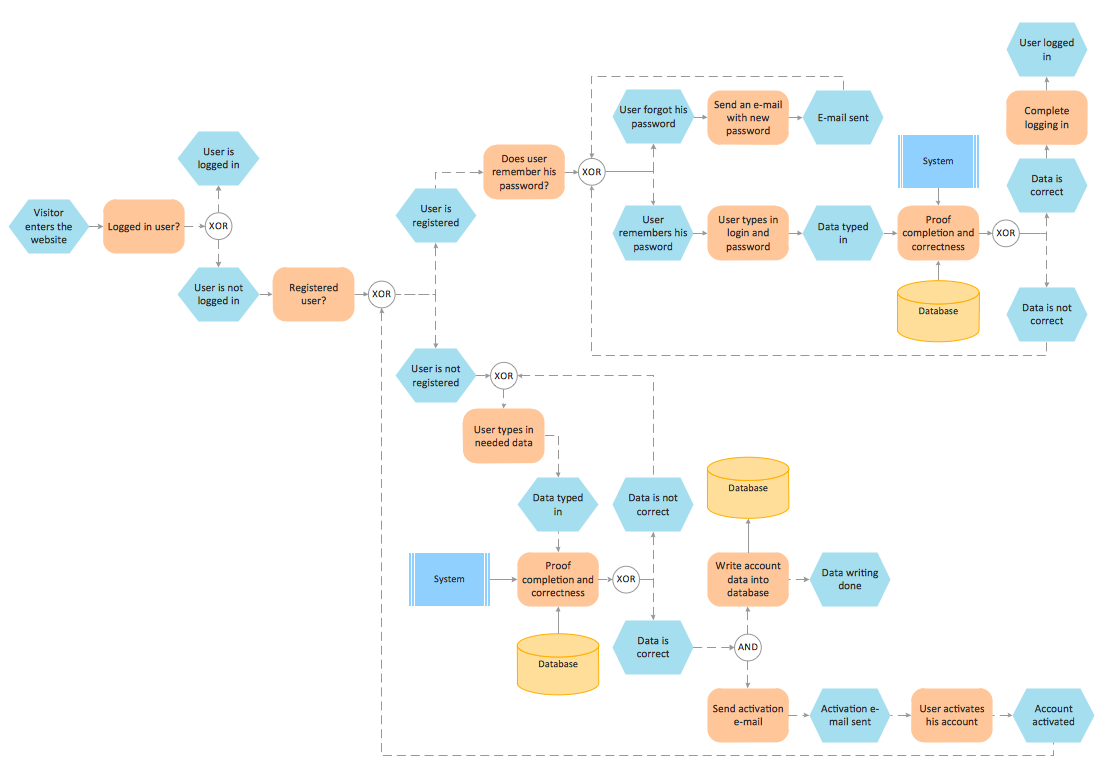
Data Flow Diagram

 Business Process Diagrams
Business Process Diagrams solution extends the ConceptDraw DIAGRAM BPM software with RapidDraw interface, templates, samples and numerous libraries based on the BPMN 1.2 and BPMN 2.0 standards, which give you the possibility to visualize equally easy simple and complex processes, to design business models, to quickly develop and document in details any business processes on the stages of project’s planning and implementation.
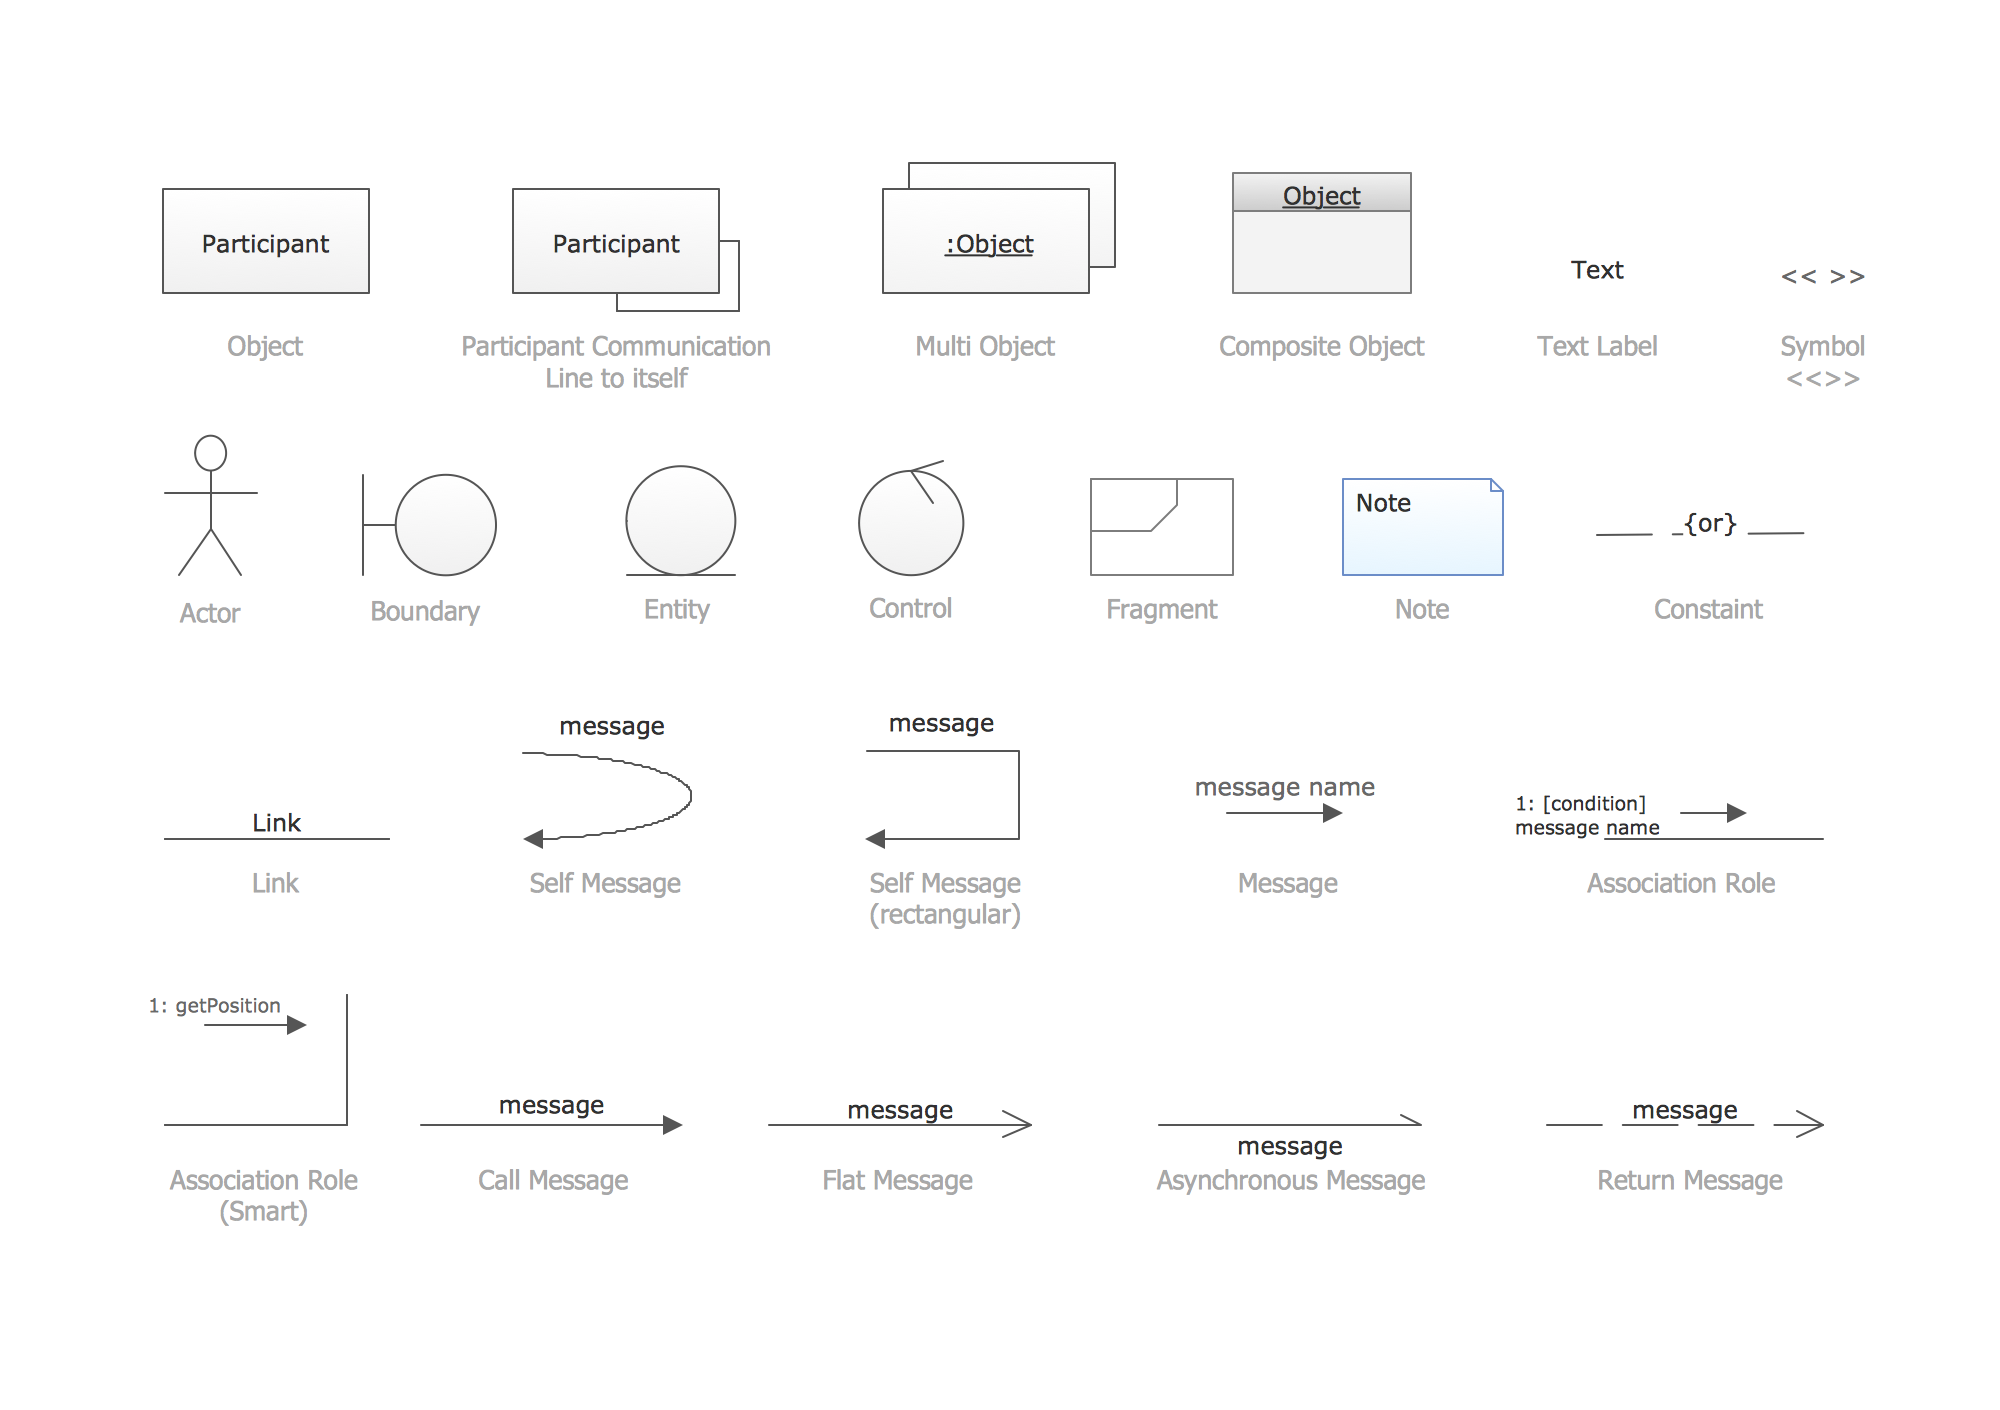
UML Collaboration Diagram. Design Elements
- Example Of Transaction Flow Chart
- Atm Transaction Process Flow Diagram
- Flowchart Diagram For A Atm Transaction To Check Your Balance
- UML activity diagram - Cash withdrawal from ATM | UML Activity ...
- Atm Transaction Flow Chart
- Draw An Atm Process Diagram
- ATM Solutions | UML Sequence Diagram | UML Use Case Diagram ...
- Atm Transaction Flow Diagram With Example
- Flow Chat Mordeling Transaction On Atm Machine
- Sales Process Flowchart | UML Activity Diagram . Professional UML ...
- UML Use Case Diagram Example. Services UML Diagram . ATM ...
- UML Activity Diagram | Business Process Diagrams | UML ...
- Flowchart For Atm Transaction
- Data Flow Diagram Of Atm Performing Transaction Process
- Flowchart For Sales Transaction
- How to Create an AWS Architecture Diagram | ATM UML Diagrams ...
- Activity Diagram For Atm Transaction Process
- Flowchart During A Transaction In A Business
- Flow Chart Showing Sales Transactions
- UML Use Case Diagram Example. Services UML Diagram . ATM ...