Example of Organizational Chart
Example of Organizational Chart - Lots of organization chart examples created by ConceptDraw Organizational Chart Software. Include company organizational chart, hospital organizational chart, hotel Organizational chart, corporate organizational chart samples etc
Classroom Seating Chart Maker
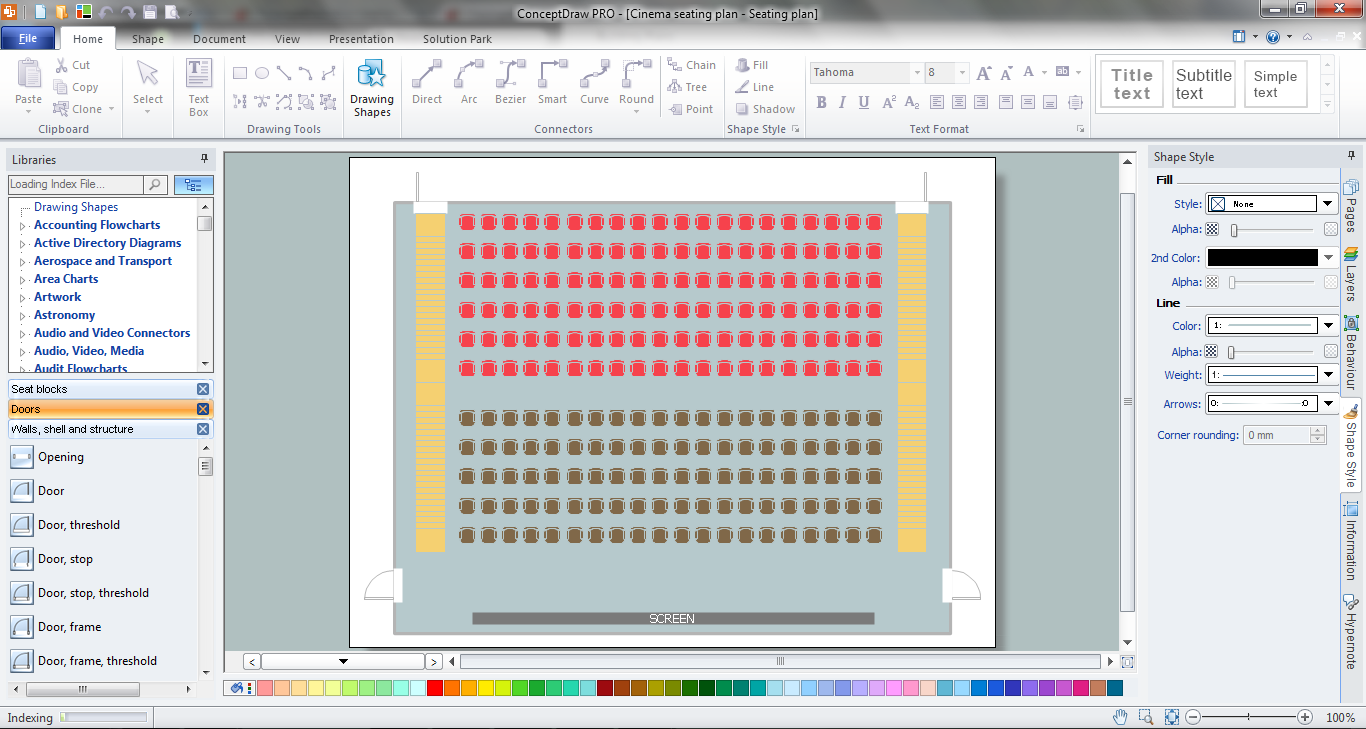
ConceptDraw DIAGRAM extended with School and Training Plans Solution from the Building Plans Area is a powerful Classroom Seating Chart Maker.Classroom Seating Chart
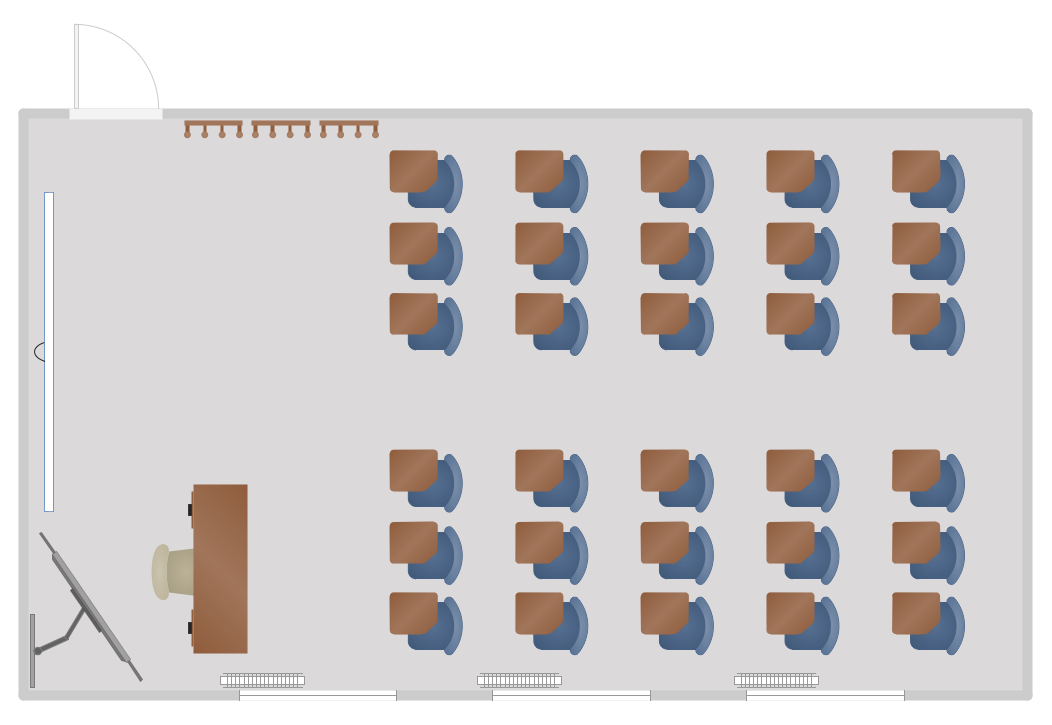
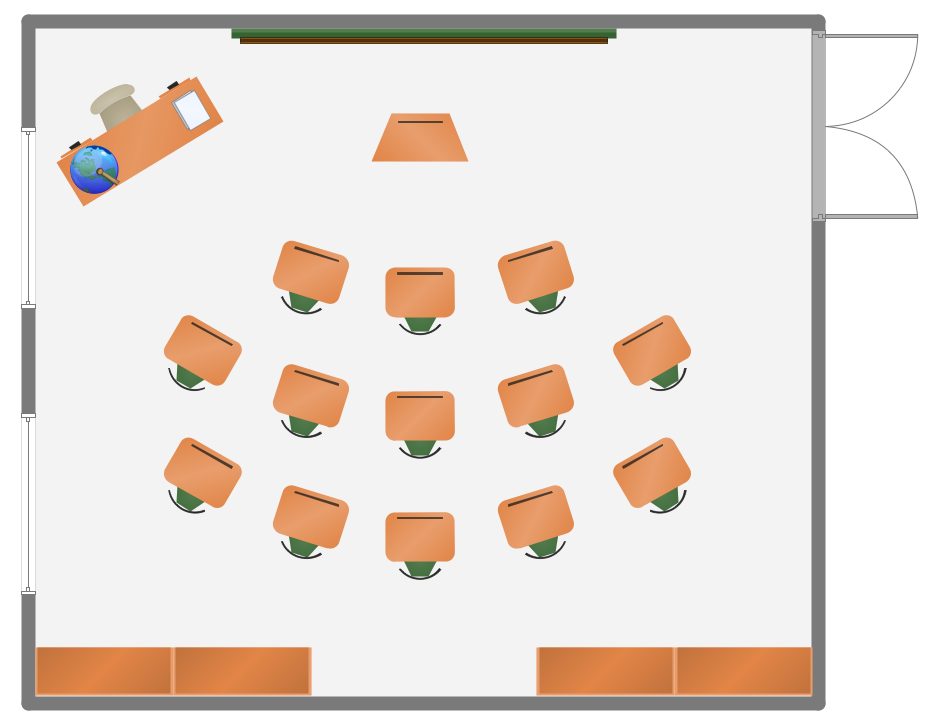
When developing the Classroom Seating Chart it is necessary to take into account the characteristics of the taken premises. Each seating place must to be comfortable and each pupil must to see good the teacher and the chalkboard. Let's design the Classroom Seating Chart in ConceptDraw DIAGRAM software extended with School and Training Plans Solution from the Building Plans Area.Classroom Seating Chart Template
ConceptDraw DIAGRAM diagramming and vector drawing software offers the School and Training Plans Solution from the Building Plans Area with extensive drawing tools, predesigned vector shapes and samples which are convenient for using as is or as classroom seating chart template.Classroom Seating Charts
Any classroom is unique for the room layout, for the location of windows and lighting, the purposes of the classes are also different, so the arrangement of chalkboard and seating places will be different and must consider all these points. ConceptDraw DIAGRAM software extended with School and Training Plans Solution from the Building Plans Area of ConceptDraw Solution Park offers you the possibility to design the Classroom Seating Charts of any complexity.
 School and Training Plans
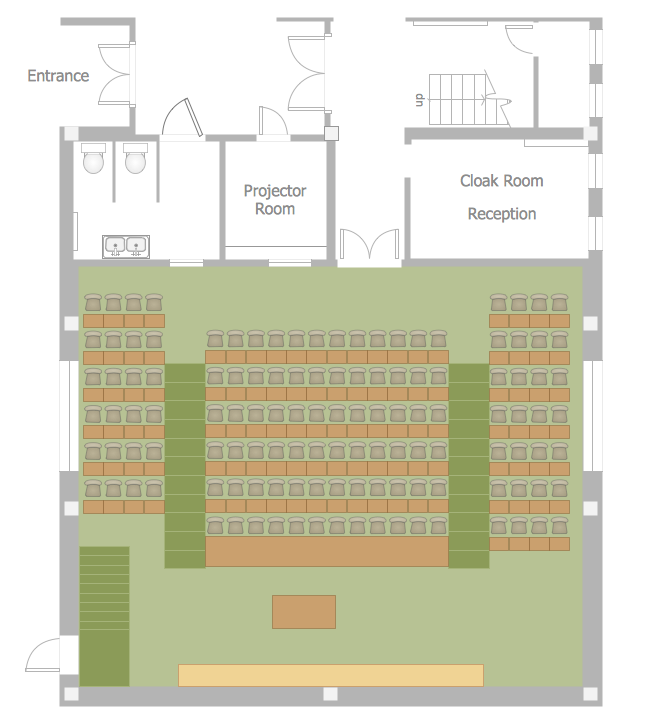
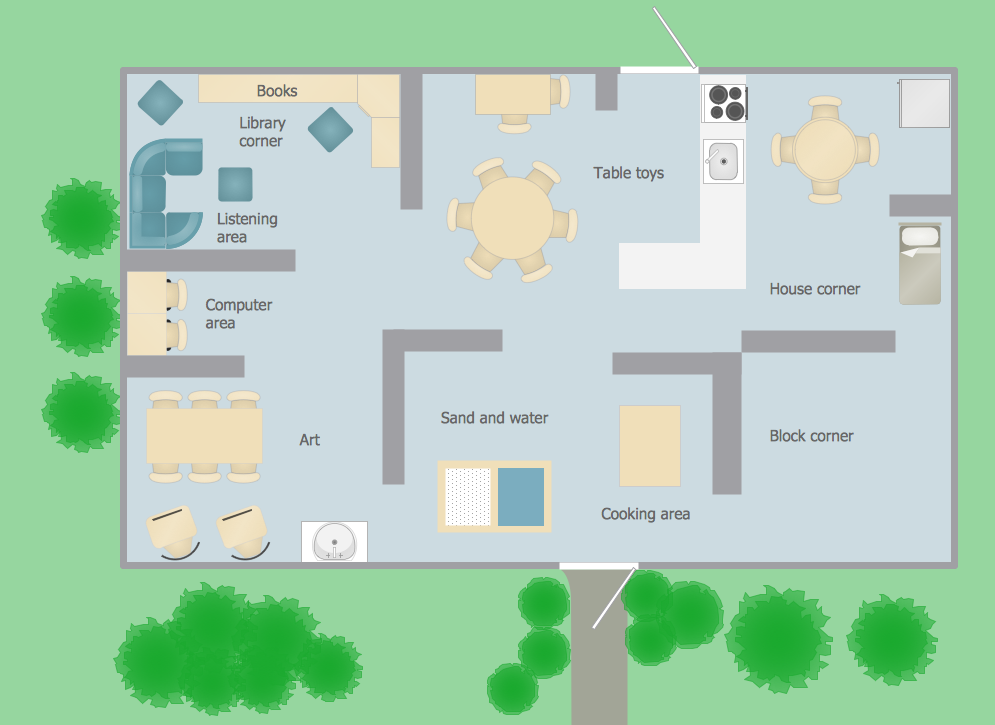
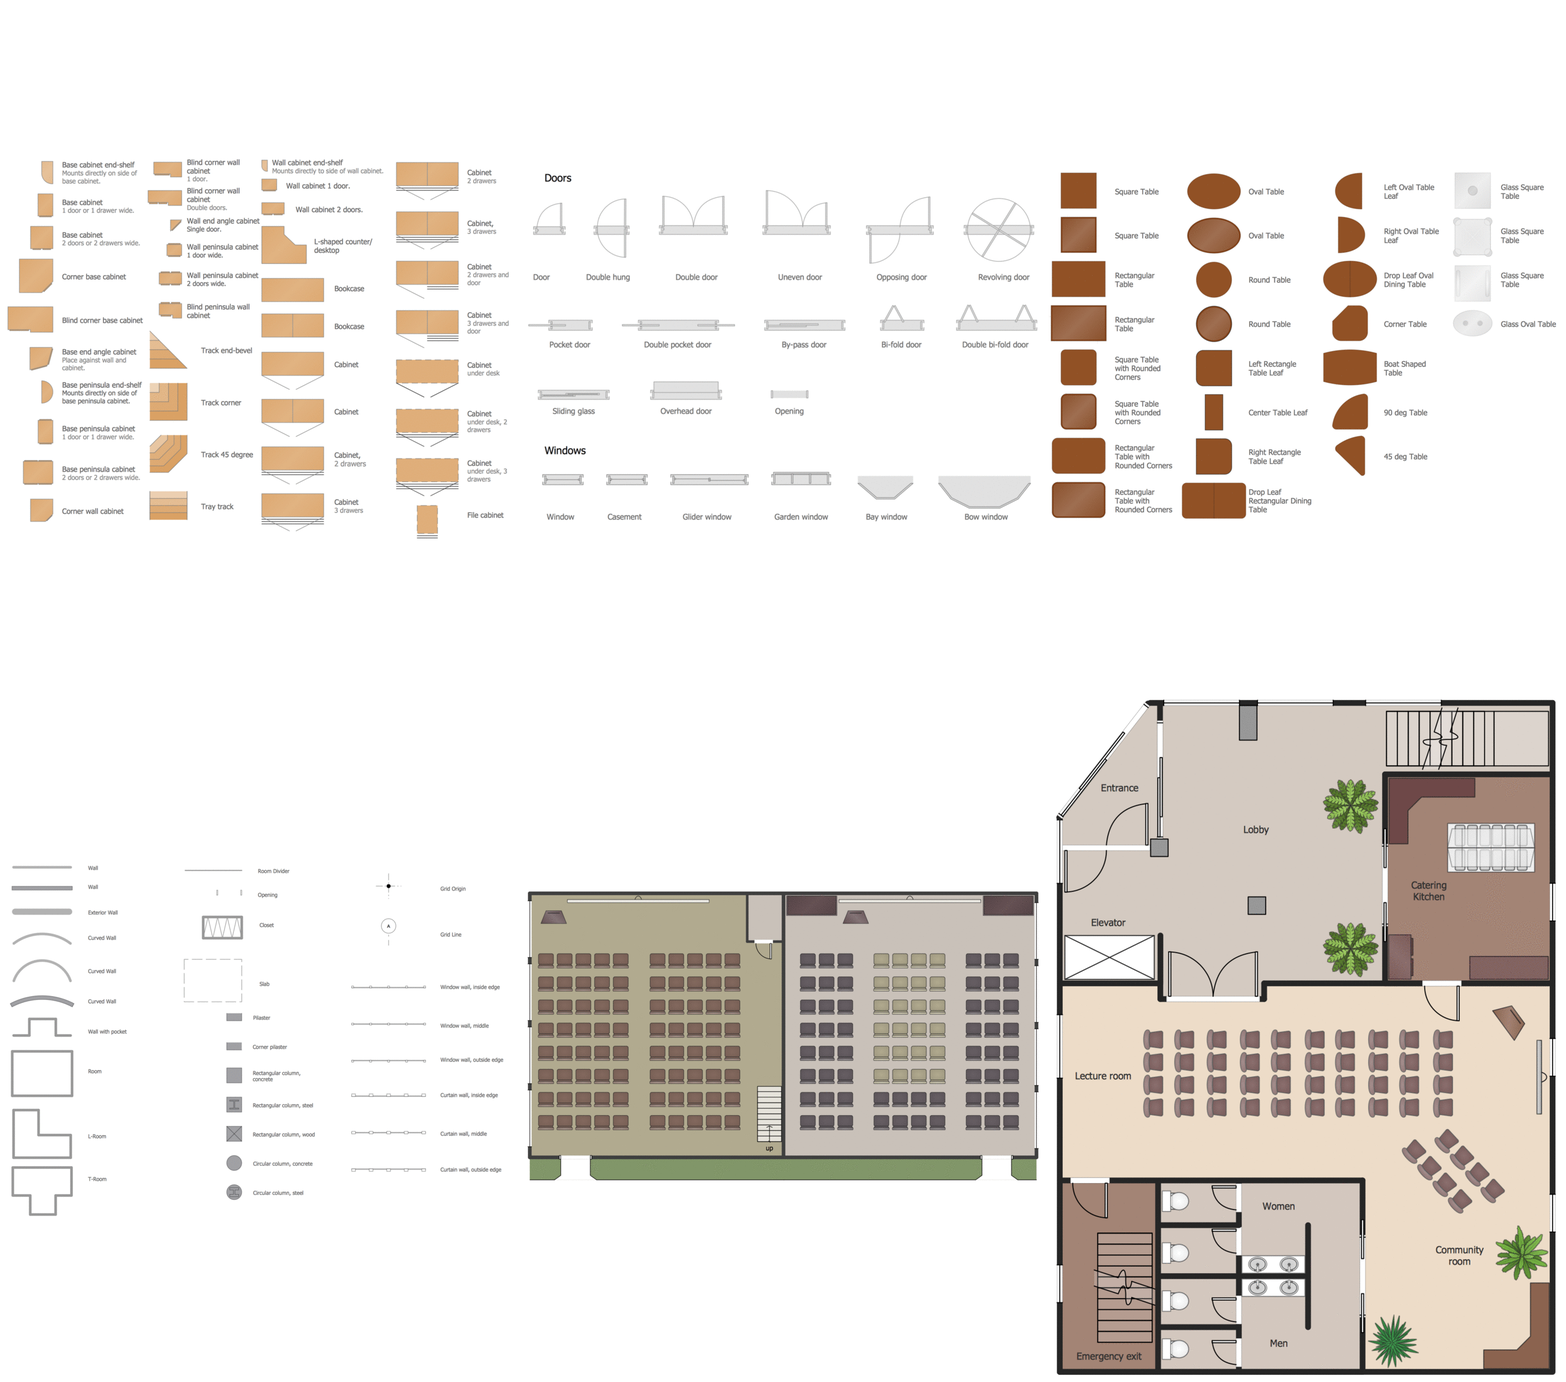
School and Training Plans solution enhances ConceptDraw DIAGRAM functionality with extensive drawing tools, numerous samples and examples, templates and libraries of classroom design elements for quick and professional drawing the School and Training plans, School Floor plans, Classroom Layout, Classroom Seating chart, Lecture Room plans of any complexity. Each offered classroom seating chart template is a real help for builders, designers, engineers, constructors, as well as teaching personnel and other teaching-related people in drawing Classroom Seating charts and Training Room layouts with ConceptDraw DIAGRAM classroom seating chart maker.
Classroom Layout
You need design the Classroom Layout for the school, high-school, university? Now it's incredibly easy to do this in ConceptDraw DIAGRAM software which was supplied with School and Training Plans Solution from the Building Plans Area.Gant Chart in Project Management
Gantt Chart is a graphical representation of tasks as segments on a time scale. It helps plan and monitor project development or resource allocation. There are list of tasks, project milesones and stages. The horizontal axis is a time scale, expressed either in absolute or relative time. Gantt chart can be used for planning in virtually any industry. There are major project planning tools using gantt chart for creating project plan. For instance, using ConceptDraw PROJECT together with ConceptDraw MINDMAP for planning marketing actions is very effective way. It makes ConceptDraw Office best marketing project management software for gantt chart planning marketing message, scheduling stages when to send massive text messages or when use email marketing services in specific projects. There are simple steps on how to use project management software for marketing, sales actions and product support. This is simple all in one toolbox for managers who need best project management software for small business as for planning and brainstorming as for reporting at project execution stage. Using gantt charts together with mindmap visuals and professional presentations charts make it excellent creative project management software. ConceptDraw PROJECT is portfolio project management software it allows manage many projects with multi gantt chart.
Chart Maker for Presentations
Easy charting software comes with beautiful chart templates and examples. This makes it easy to create professional charts without prior experience.Pie Chart Software
A pie chart is a circular diagram showing a set of data divided into proportional slices. There are several variations of this chart such as donut chart, exploded pie chart, multi-level pie charts. Although it is not very informative when a ring chart or circle chart has many sections, so choosing a low number of data points is quite important for a useful pie chart. ConceptDraw DIAGRAM software with Pie Charts solution helps to create pie and donut charts for effective displaying proportions in statistics, business and mass media for composition comparison, i.e. for visualization of part percentage inside one total.Seating Chart Template Free
You need design the seating chart? The simple way is to use the specialized software. ConceptDraw DIAGRAM diagramming and vector drawing software extended with Seating Plans solution from the Building Plans area with powerful drawing tools, samples, seating chart template free will be ideal for you.Marketing Flow Chart
ConceptDraw DIAGRAM diagramming and vector drawing software extended with Marketing Diagrams Solution from the Marketing Area of ConceptDraw Solution Park is the best software for quick and easy creating Marketing Flow Chart of any complexity and design. This charts created to define marketing project stages. In small business project management it sometimes generated by simple marketing project management software. Here is samples which included in Marketing Area of ConceptDraw Solution Park and it can be used as for project planning software as for project management report.Building Drawing Software for Design School Layout
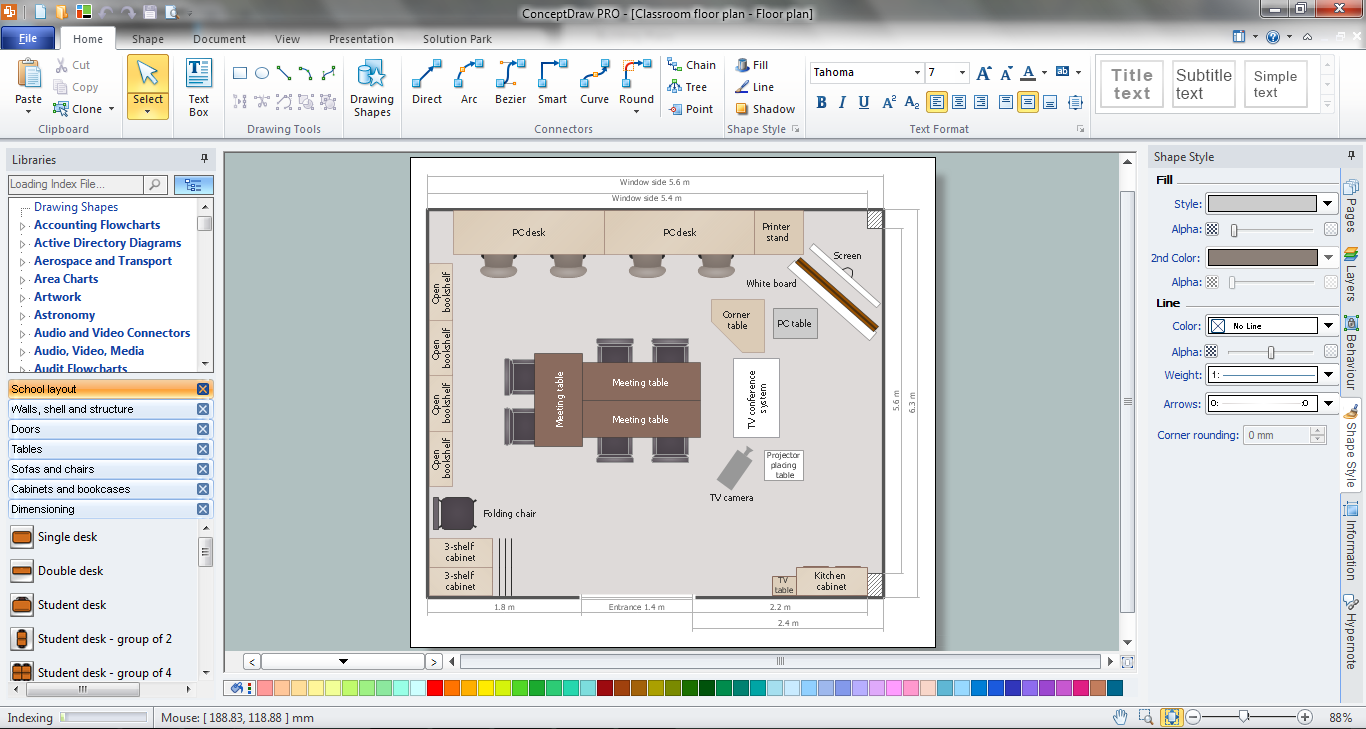
Classroom is the place where the pupils spend most of time, so it must to attract, arouse the interest, to be comfortable that the pupils wanted to go here and to stay longer. The psychologists say that the look of a class greatly affects the children. The first important characteristic is a color, the correct choice of color palette for the training premise helps adjust pupils and students on the right mood, promotes a thinking, activity, creativity and concentration. The most favorable colors are yellow, peach, beige, they attract attention and stimulate mental activity. As for the desks and other furniture, they should to be safe, quality, and to be arranged taking in account the room's size, lighting and age of pupils. For the primary classes are perfectly suited various illustrations on the walls. Use ConceptDraw DIAGRAM building drawing software tools and vector design elements from School and Training Plans solution for development School layouts and floor plans, furniture and equipment plans for School or Training offices, Design plans for classrooms, auditoriums and cabinets.
Horizontal Orgchart
The Organizational Chart is a diagram that shows the structure of the organization and the relationships of its parts. There are many ways to present the Organizational Chart. One of them is the Horizontal Organizational Chart: the parts of the diagram are arranged from left to right, or from right to left. This sample was created in ConceptDraw DIAGRAM diagramming and vector drawing software using the Organizational Charts Solution from the Management area of ConceptDraw Solution Park.
 Area Charts
Area Charts are used to display the cumulative totals over time using numbers or percentages; or to show trends over time among related attributes. The Area Chart is effective when comparing two or more quantities. Each series of data is typically represented with a different color, the use of color transparency in an object’s transparency shows overlapped areas and smaller areas hidden behind larger areas.
- School Management Structure In A Flow Diagram
- Flow Chart Of Management Structure Of Any School
- Draw The Flow Chart Of School
- Top 5 Android Flow Chart Apps | Basic Audit Flowchart. Flowchart ...
- School Organizational Chart
- School and Training Plans | Classroom Seating Chart Maker ...
- How to Draw an Organization Chart | Examples of Flowcharts, Org ...
- Flow Chart For School Projects
- Diagram Of An Organisational Chart And Departments Of A School
- School Management Diagram In Flowchart
- School Org Chart
- The Diagram Of An Organisation Chart Of A School
- Classroom Seating Chart Maker | Bubble Diagrams | Interior Design ...
- Example of Organizational Chart | Building Drawing Software for ...
- School Organizational Structure Chart
- Organisation Chart For Secondary School In Nigeria
- Bubble Chart Maker | Classroom Seating Chart Maker | Basic ...
- Network Icon | H P Flow Chart On School Management
- How To Draw Building Plans | Classroom Seating Chart | School ...
- School Organizational Chart And Its Function

