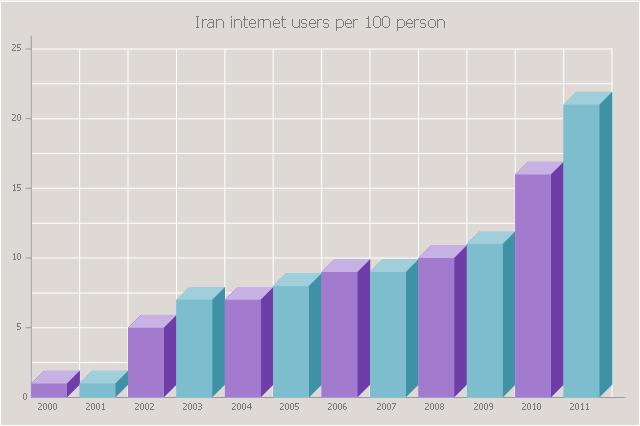
The 3D vertical bar graph sample shows the Iran internet users per 100 person from 2000 to 2011. It was designed on the base of the Commons Wikimedia file: Iran internet users per 100 person.png.
[commons.wikimedia.org/ wiki/ File:Iran_ internet_ users_ per_ 100_ person.png]
This file is licensed under the Creative Commons Attribution-Share Alike 3.0 Unported license. [creativecommons.org/ licenses/ by-sa/ 3.0/ deed.en]
The data source is World Bank: [data.worldbank.org/ country/ iran-islamic-republic]
"In 1993 Iran became the second country in the Middle East to be connected to the Internet, and since then the government has made significant efforts to improve the nation's ICT infrastructure. Iran's national Internet connectivity infrastructure is based on two major networks: the public switched telephone network (PSTN) and the public data network. The PSTN provides a connection for end-users to Internet service providers (ISPs) over mostly digital lines and supports modem-based connections. The Data Communication Company of Iran (DCI), a subsidiary of TCI, operates the public data network." [Internet in Iran. Wikipedia]
The 3D column chart example "Iran internet users per 100 person" was created using the ConceptDraw PRO diagramming and vector drawing software extended with the Bar Graphs solution from the Graphs and Charts area of ConceptDraw Solution Park.
Column Chart Software
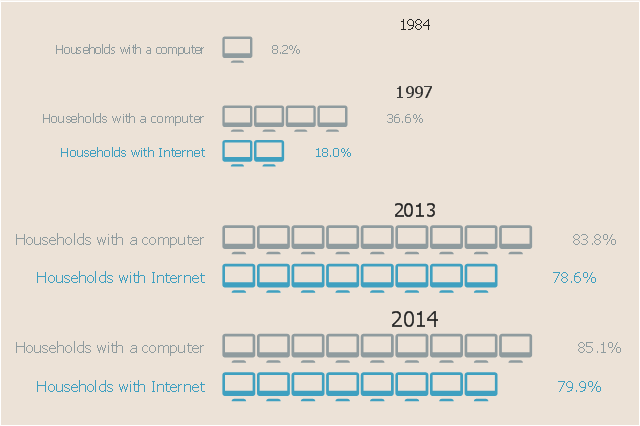
ConceptDraw Column Chart software allows drawing column charts using predesigned objects or drawing tools. In ConceptDraw Column Chart software you can find a complete set of column chart tools and objects.This picture bar graph sample shows the computer and Internet use at home from 1984 to 2014. It was designed using data from website of the United States Census Bureau (USCB).
[census.gov/ content/ dam/ Census/ library/ visualizations/ 2016/ comm/ digital_ nation.png]
"Home automation is the residential extension of building automation and involves the control and automation of lighting, heating, ventilation, air conditioning (HVAC), appliances, and security. Modern systems generally consist of switches and sensors connected to a central hub sometimes called a "gateway" from which the system is controlled with a user interface that is interacted either with a wall-mounted terminal, mobile phone software, tablet computer or a web interface." [Home automation. Wikipedia]
The pictorial chart example "Computer and Internet use at home over time" was created using the ConceptDraw PRO diagramming and vector drawing software extended with the Picture Graphs solution from the Graphs and Charts area of ConceptDraw Solution Park.
Column Chart Template
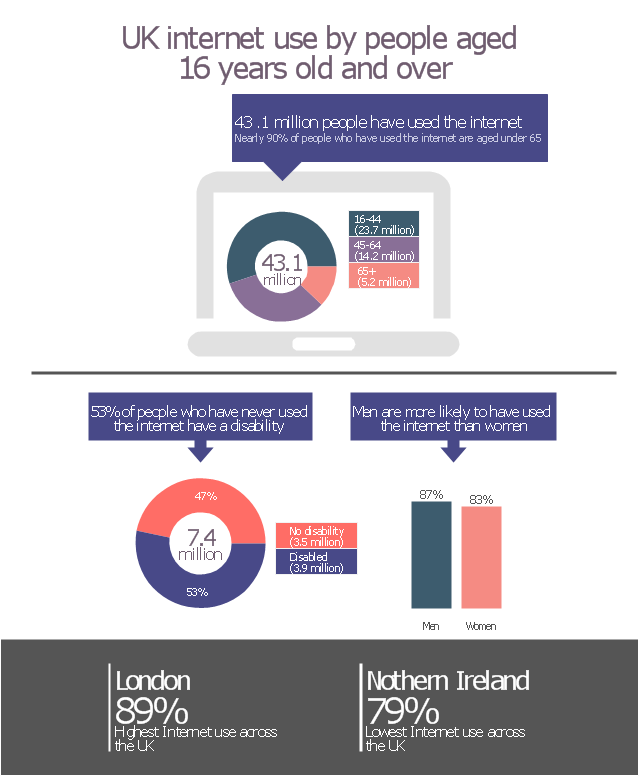
Column chart templates from ConceptDraw collection can help you find the best visual depiction for you data. You can easily modify column chart templates according to data you want to visualize.This data-driven infographics example was redesigned from the Wikimedia Commons file: UK internet use by people aged 16 years and over. Estimates of people who have ever or never used the Internet, Quarter 1 2013.png.
"UK internet use by people aged 16 years and over. Estimates of people who have ever or never used the Internet, Quarter 1 2013." [commons.wikimedia.org/ wiki/ File:UK_ internet_ use_ by_ people_ aged_ 16_ years_ and_ over._ Estimates_ of_ people_ who_ have_ ever_ or_ never_ used_ the_ Internet,_ Quarter_ 1_ 2013.png]
The donut chart and column graph sample "UK internet use by people" was created using the ConceptDraw PRO diagramming and vector graphics software extended with the Data-driven Infographics" solution from the area "What is infographics" of ConceptDraw Solution Park.
The Best Mac Software for Diagramming or Drawing
ConceptDraw PRO is a powerful intelligent vector graphics engine that can be used to create basic diagrams including flowcharts, charts, workflows, flowcharts, organizational charts, business diagram, learn business diagrams, flow diagrams.
Gantt Chart Software
The Gantt Chart is the main interface in ConceptDraw PROJECT. It summarizes the tasks in your project and presents them graphically so you can easily view your progress.DroidDia prime
Droiddia allows you to make flow charts org charts venn diagrams mindmaps and do other diagrams with no constrains and as little effort as possible.Pictorial Chart
You want design Pictorial Chart or Infographic? And you need powerful infographic software? Then ConceptDraw PRO diagramming and vector drawing software extended with Pictorial Infographics Solution from the “What are Infographics” Area is exactly what you need.Column Chart Examples
Column chart examples from ConceptDraw collection can help you find the best visual depiction for you data. You can easily modify column chart examples according to data you want to visualize.Chart Examples
Easy charting software comes with beautiful chart templates and examples. This makes it easy to create professional charts without prior experience.Good Flow Chart app for Mac
The ConceptDraw PRO is a good flow chart app for Mac. Numerous vector stencils, samples and templates created by designers allows you to draw any type of flowchart.How to Draw Pictorial Chart. How to Use Infograms
How to draw pictorial chart quick, easy and effective? ConceptDraw PRO offers the unique Pictorial Infographics Solution that will help you! Pictorial Infographics solution contains large number of libraries with variety of predesigned vector pictograms that allows you design infographics in minutes. There are available 10 libraries with 197 vector pictograms.Chart Templates
Easy charting software comes with beautiful chart templates and examples. This makes it easy to create professional charts without prior experience.HelpDesk
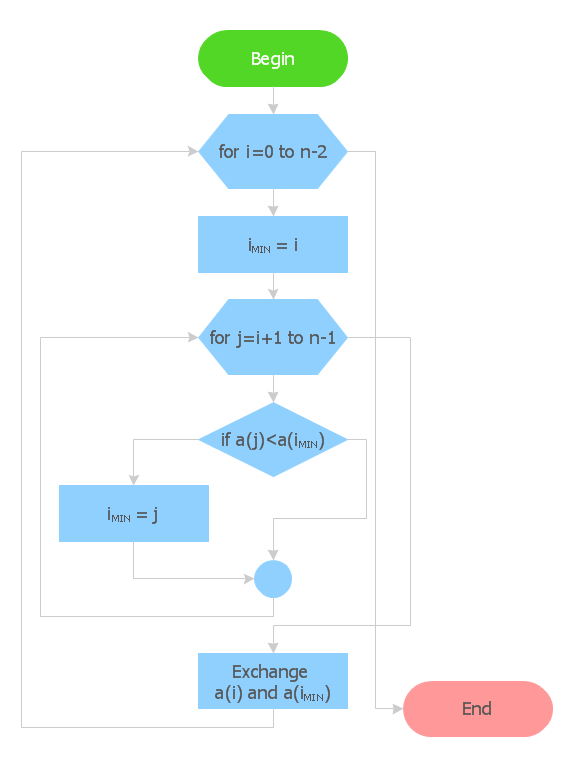
How to Create Flowchart Using Standard Flowchart Symbols
Flowcharts are used to display an algorithm for consistent execution of certain steps. Flowchart is probably the easiest way to make a graphical representation of any process. Flowcharts use the set of standard geometric symbols and arrows to define relationships. ConceptDraw PRO allows you to create professional flowchart quickly and easily. The ability to create flowcharts is contained in the Flowcharts solution. The solution provides a set of special tools for creating flowcharts.- How to Share Mind Maps via Internet | Concept Maps | Donut Chart ...
- Chart On Communication Services On Internet
- 3D Column chart - Iran internet users per 100 person | Providing ...
- Internet Connectivity. Computer and Network Examples | Internet ...
- How To Make Chart On Services Provided By Internet
- 3D Column chart - Iran internet users per 100 person | Network ...
- 3D Column chart - Iran internet users per 100 person | Column Chart ...
- Create A Chart Presentation Ondepicting Services Available On ...
- Internet Connectivity. Computer and Network Examples ...
- Gantt Chart Software | Internet Connectivity. Computer and Network ...
- 3D Column chart - Iran internet users per 100 person | Bar Graphs ...
- Draw A Chart On Different Services Provided By Internet
- Various Services Provided By Internet Flow Chart
- Internet Connectivity. Computer and Network Examples | 3D Column ...
- 3D Column chart - Iran internet users per 100 person | National ...
- Column Chart Examples | Column Chart Template | Column Chart ...
- 3D Column chart - Iran internet users per 100 person | Column Chart ...
- 3D Column chart - Iran internet users per 100 person | Person ...
- Column Chart Examples | Column Chart Software | Chart Maker for ...
- Construction Project Chart Examples | How to Create Gantt Chart ...



.jpg)


