 ConceptDraw Solution Park
ConceptDraw Solution Park collects graphic extensions, examples and learning materials
HelpDesk
How to Draw the Different Types of Pie Charts
Using the Pie Chart, you can visually estimate the relative contribution that different data categories contribute to a whole value. The pie chart displays the statistics in a visual format. The main use of pie charts to show comparisons. The larger piece of the pie, the more the value of this value compared to the rest. Various applications of pie charts can be found in business and education. For business, pie charts can be used to compare the success or failure of the goods or services. They may also be used to display the business market share.HelpDesk
How To Create a PERT Chart
Project Evaluation and Review Technique (PERT) is a method of project tasks evaluation and analysis. PERT - is a method of analyzing the tasks required to complete the project. It includes analysis of the time required to complete each task, as well as the determination of the time required to carry out the whole project. PERT was developed to facilitate the planning of huge and complex projects. PERT is used for very large, complex, and non-standard projects. Technology implies the presence of uncertainty, making it possible to develop a schedule of the project without a precise information on details and time required for all of its components. The most popular part of PERT is a method of the critical path, based on the construction of the network schedule (PERT network diagram). ConceptDraw Office delivers you the best way to create PERT chart for your project using compatibility between ConceptDraw PROJECT and ConceptDraw PRO.HelpDesk
How to Create a Timeline Diagram in ConceptDraw PRO
A Timeline is a chart which displays a project plan schedule in chronological order. A Timeline is used in project management to depict project milestones and visualize project phases, and show project progress. The graphic form of a timeline makes it easy to understand critical project milestones, such as the progress of a project schedule. Timelines are particularly useful for project scheduling or project management when accompanied with a Gantt chart. It captures the main of what the project will accomplish and how it will be done. making a project timeline is one of the most important skills a project manager needs have. Making comprehensive, accurate timelines allows you getting every project off in the best way. ConceptDraw PRO allows you to draw a timeline charts using special library.HelpDesk
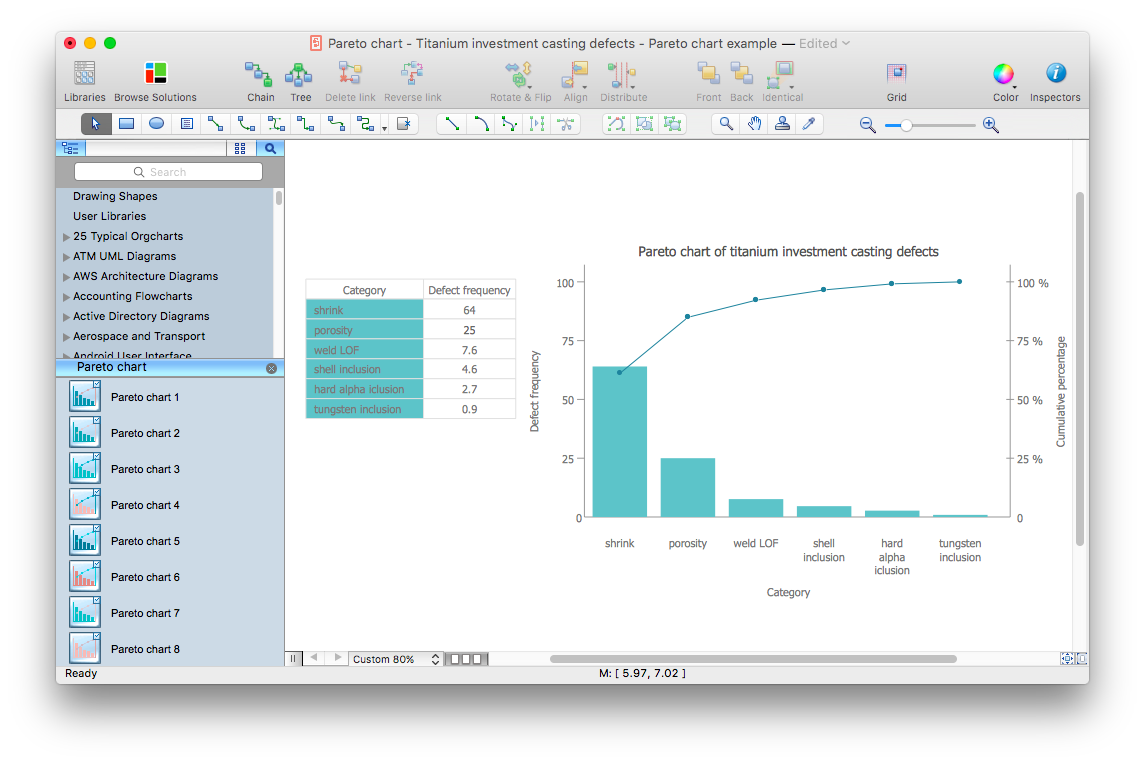
How to Draw a Pareto Chart Using ConceptDraw PRO
The Seven Basic Tools of Quality were picked as effective visual tool-set for identifying the root cause of quality-related problems within the workplace. Seven Basic Tools of Quality comprise of seven diagram that are diverse enough to be used to any business troubleshooting scenario, but simple enough that employees of all types can understand and apply them. One of these tools is a Pareto chart. It combines both a line graph and a bar chart, where the bar chart displays data values, and a line represents a total value. Pareto chart is used for quality control to identify the source of the quality problem. ConceptDraw Seven Basic Tools of Quality solution delivers a big set of vector stencil libraries and samples for each quality control diagram, including a Pareto chart.HelpDesk
How to Draw a Scatter Diagram Using ConceptDraw PRO
Scatter Diagrams are used to visualize how a change in one variable affects another. A Scatter Diagram displays the data as a set of points in a coordinate system. It combines these values into single data points and displays them in uneven intervals. A Scatter Diagram can be very useful to for identifying relationships between variables, for example the relationship of price and quality rating. Making a Scatter Diagram involves many different elements that can be managed using ConceptDraw Scatter Diagram solution.- Plotting Graphs Online
- Online Printable Calendar 2016
- Flow Chart Online | What is Interactive Flowcharts | How to Create a ...
- Flow Chart Online
- Flow Chart Online | ConceptDraw Solution Park | How To Create a ...
- Flow Chart Online | How to Create a Timeline Diagram in ...
- Flow Chart Diagram Online Shopping Examples
- Flow Chart Online | How to Draw an Organizational Chart Using ...
- Online Diagram Tool | Flow Chart Online | ConceptDraw Solution ...
- State Diagram Example - Online Store
- Flow Chart Online | Top 5 Android Flow Chart Apps | ConceptDraw ...
- Online store social media response flowchart | Flow chart Example ...
- Flow Chart Online | Top 5 Android Flow Chart Apps | How To Create ...
- Flow Chart Online | Online Flow Chart | Program Evaluation and ...
- Online Flow Chart | Work Order Process Flowchart. Business ...
- How To Create a PERT Chart | Flow Chart Online | How to Draw the ...
- Online Diagram Tool | Flow Chart Online | Example of DFD for ...
- Flow Chart Online | State Diagram Example - Online Store | Process ...
- Flow Chart Online | ConceptDraw Solution Park | Online Flow Chart ...
- Flow Chart Online | Online Flow Chart | ConceptDraw Solution Park ...


