Flow Chart for Olympic Sports
Sports Selection Flow Chart - This sample was created in ConceptDraw PRO using the Flowcharts Solution from the Marketing Area and shows the Flow Chart of sport selection. An experienced user spent 10 minutes creating this sample.Basic Diagramming
Create flowcharts, organizational charts, bar charts, line graphs, and more with ConceptDraw PRO.
 Football
The Football Solution extends ConceptDraw PRO v9.5 (or later) software with samples, templates, and libraries of vector objects for drawing football (American) diagrams, plays schemas, and illustrations. It can be used to make professional looking documen
 Winter Sports
The Winter Sports solution from Sport area of ConceptDraw Solution Park contains winter sports illustration examples, templates and vector clipart libraries.
Percentage Spider Chart
ConceptDraw PRO creates drawings, diagrams and charts with great visual appeal in Mac OS X. This sample shows the Spider Chart that represents the buyer perceptions of the leather footwear industries in Brazil, India and Italy.Radar Chart
This sample shows the Radar Chart that compares the internet dimensions in the four countries. The Radar Chart represents the multivariate data as a two-dimensional chart with three or more variables displayed on the axes that start in one point. The Radar Charts are used in the quality management, business, analytics and sport.
 ConceptDraw Solution Park
ConceptDraw Solution Park collects graphic extensions, examples and learning materials
HelpDesk
How to Draw a Gantt Chart Using ConceptDraw PRO
A Gantt chart is intended to provide a visualization of a project schedule. It is developed to help planning, coordinating, and tracking on project tasks implementation. One of the most critical resources for a project implementation is a time resources. Gantt chart - is one of the most convenient and popular way of graphical representation of a project tasks progress in conjunction with the corresponding time consumption. Gantt chart's function is to show project tasks completion in a progress, and to make a project manager sure that project tasks were completed on time. ConceptDraw Office is a clear and easy-to-use tool for project management. It is a very handy visual tool that helps make a project processing clear.HelpDesk
How to Create PowerPoint Presentation from Data Driven Infographics Using ConceptDraw PRO
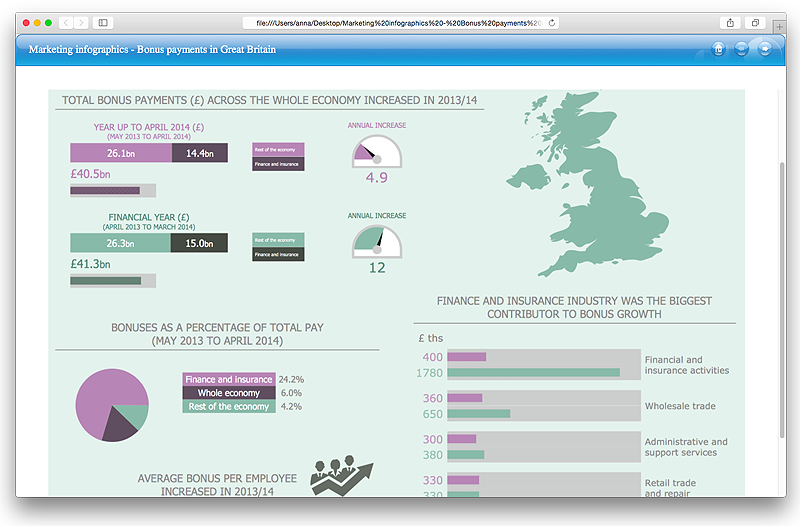
ConceptDraw PRO can be used as a tool for creating data-driven infographics. It allows you to draw data driven using the special templates and vector stencils libraries. ConceptDraw PRO allows you to make a MS PowerPoint Presentation from your Data-driven infographics in a few simple steps.HelpDesk
How to Make a Web Page from Infographics in ConceptDraw PRO
Create your own original marketing illustrations and infographics, presentation slides, website, and blog pages using ConceptDraw PRO.
 Sport Field Plans
Construction of sport complex, playgrounds, sport school, sport grounds and fields assumes creation clear plans, layouts, or sketches. In many cases you need represent on the plan multitude of details, including dimensions, placement of bleachers, lighting, considering important sport aspects and other special things.
 Basketball
The Basketball Solution extends ConceptDraw PRO v9.5 (or later) software with samples, templates, and libraries of vector objects for drawing basketball diagrams, plays schemas, and illustrations. It can be used to make professional looking documents, pre
HelpDesk
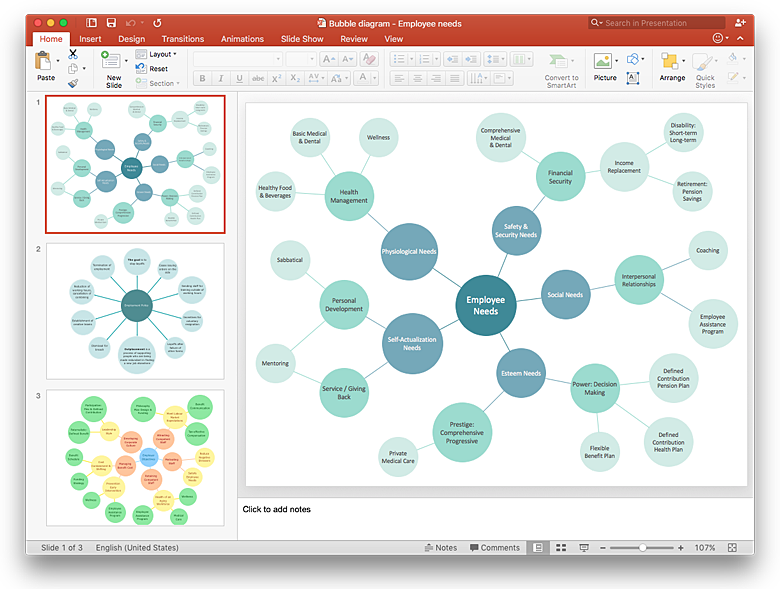
How to Add a Bubble Diagram to a PowerPoint Presentation Using ConceptDraw PRO
Bubble diagrams can be used to compare concepts, and identify areas of similarity and difference. ConceptDraw PRO allows you to make a MS PowerPoint Presentation from your charts in a few simple steps.
 Area Charts
Area Charts are used to display the cumulative totals over time using numbers or percentages; or to show trends over time among related attributes. The Area Chart is effective when comparing two or more quantities. Each series of data is typically represented with a different color, the use of color transparency in an object’s transparency shows overlapped areas and smaller areas hidden behind larger areas.
- Flow Chart for Olympic Sports | Mac Compatible Remote ...
- Flow Chart Of How To Make Good Presentation
- Flow Chart for Olympic Sports | Flowchart | ConceptDraw Solution ...
- Sport Field Plans | Seating Plans | Basic Flowchart Symbols and ...
- How To Create a Bubble Chart | Bubble Map Maker | Interior Design ...
- How to Create Presentation of Your Project Gantt Chart | Flow Chart ...
- Diagram And Its Explanation On Importance Of Sports
- Sport Field Plans | Winter Sports | ConceptDraw Solution Park | Bar ...
- Cluster Chart
- Flow Chart for Olympic Sports | Building Drawing Software for ...
- Spider Chart Template | Radar Chart | Chart Maker for Presentations ...
- Spider Chart Template | Percentage Spider Chart | Chart Maker for ...
- Gantt Chart Diagram For Sports Shop Management System
- Winter Sports Vector Clipart. Medal Map. Spatial Infographics ...
- Flow Chart for Olympic Sports | Creating a Simple Flowchart ...
- Pie Chart Software | Organizational Chart Templates | Chart Maker ...
- Flow Chart for Olympic Sports | Basic Diagramming | How to Create ...
- How to Draw Pictorial Chart . How to Use Infograms | Sport ...
- Flow Chart for Olympic Sports | Flowchart | Building Drawing ...


