Use this template to design your area graphs.
"An area chart or area graph displays graphically quantitive data. It is based on the line chart. The area between axis and line are commonly emphasized with colors, textures and hatchings. Commonly one compares with an area chart two or more quantities.
Area charts are used to represent cumulated totals using numbers or percentages (stacked area charts in this case) over time. Use the area chart for showing trends over time among related attributes. The area chart is like the plot chart except that the area below the plotted line is filled in with color to indicate volume.
When multiple attributes are included, the first attribute is plotted as a line with color fill followed by the second attribute, and so on." [Area chart. Wikipedia]
The template "Area chart" for the ConceptDraw PRO diagramming and vector drawing software is included in the Area Charts solution from the Graphs and Charts area of ConceptDraw Solution Park.
Template
Line Chart Template for Word

Gantt Chart Templates

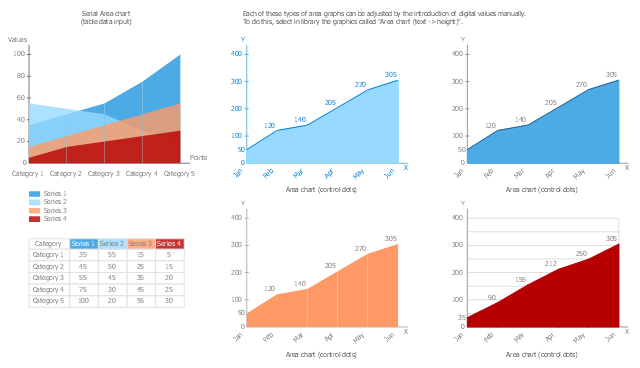
The vector stencils library Area Charts contains 9 templates to draw area graphs using the ConceptDraw PRO diagramming and vector drawing software .
"An area chart or area graph displays graphically quantitive data. It is based on the line chart. The area between axis and line are commonly emphasized with colors, textures and hatchings. ...
Area charts are used to represent cumulated totals using numbers or percentages (stacked area charts in this case) over time. Use the area chart for showing trends over time among related attributes." [Area chart. Wikipedia]
The area chart example "Design elements - Area charts" is included in the Area Charts solution from the Graphs and Charts area of ConceptDraw Solution Park.
Graph templates
Pie Chart Word Template. Pie Chart Examples

Bar Chart Template for Word

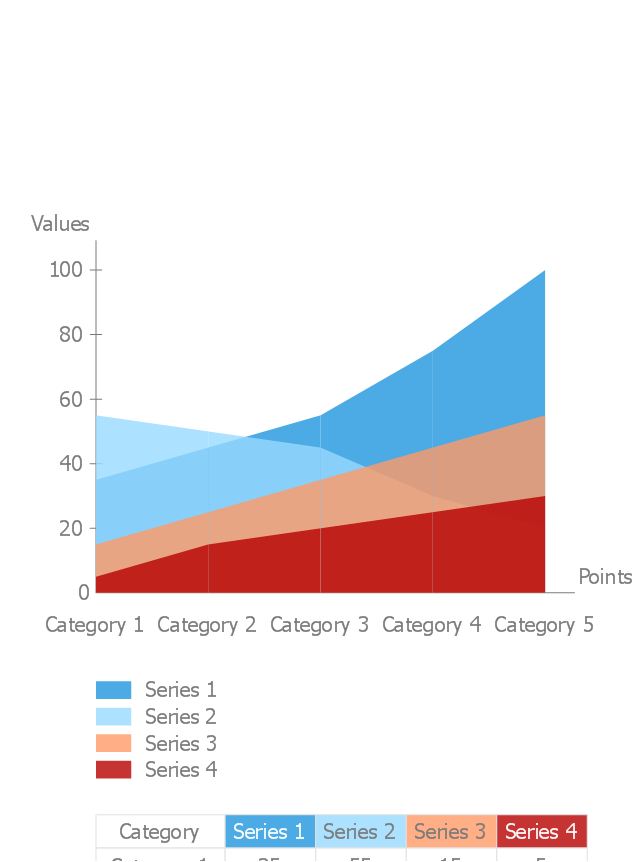
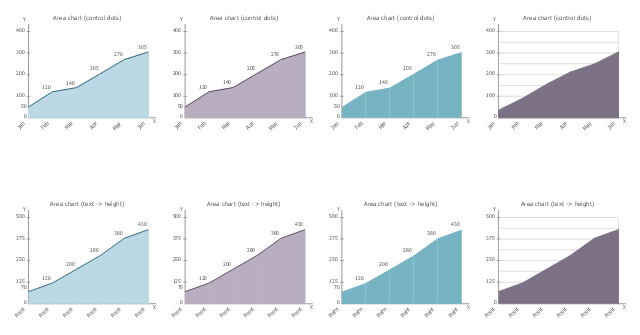
The vector stencils library "Area charts" contains 9 area chart templates you can drag into your document and set data by numbers entering or moving control dots. Use these templates to draw your area graphs in the ConceptDraw PRO diagramming and vector drawing software.
The vector stencils library "Area charts" is included in the Area Charts solution from the Graphs and Charts area of ConceptDraw Solution Park.
The vector stencils library "Area charts" is included in the Area Charts solution from the Graphs and Charts area of ConceptDraw Solution Park.
Area chart (control dots)
-area-charts---vector-stencils-library.png--diagram-flowchart-example.png)
Area chart (text -> height)
-area-charts---vector-stencils-library.png--diagram-flowchart-example.png)
Area chart (control dots)
-area-charts---vector-stencils-library.png--diagram-flowchart-example.png)
Area chart (text -> height)
-area-charts---vector-stencils-library.png--diagram-flowchart-example.png)
Area chart (control dots)
-area-charts---vector-stencils-library.png--diagram-flowchart-example.png)
Area chart (text -> height)
-area-charts---vector-stencils-library.png--diagram-flowchart-example.png)
Area chart (control dots)
-area-charts---vector-stencils-library.png--diagram-flowchart-example.png)
Area chart (text -> height)
-area-charts---vector-stencils-library.png--diagram-flowchart-example.png)
Area chart - serial
Pie Chart Examples and Templates

Chart Templates

Seating Chart Template

Table Seating Chart Template

 Area Charts
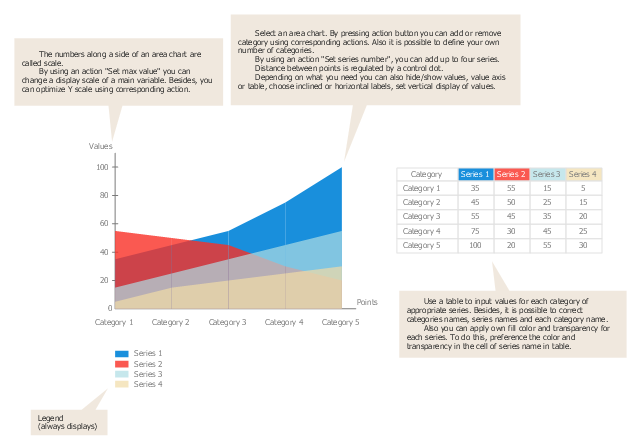
Area Charts are used to display the cumulative totals over time using numbers or percentages; or to show trends over time among related attributes. The Area Chart is effective when comparing two or more quantities. Each series of data is typically represented with a different color, the use of color transparency in an object’s transparency shows overlapped areas and smaller areas hidden behind larger areas.
Organization Chart Templates

The vector stencils library Area Charts contains 8 templates to draw area graphs using the ConceptDraw PRO diagramming and vector drawing software .
"An area chart or area graph displays graphically quantitive data. It is based on the line chart. The area between axis and line are commonly emphasized with colors, textures and hatchings. ...
Area charts are used to represent cumulated totals using numbers or percentages (stacked area charts in this case) over time. Use the area chart for showing trends over time among related attributes." [Area chart. Wikipedia]
The area chart example "Design elements - Area charts" is included in the Basic Area Charts solution from the Graphs and Charts area of ConceptDraw Solution Park.
Area chart templates
 Basic Area Charts
This solution extends the capabilities of ConceptDraw PRO v10.3.0 (or later) with templates, samples and a library of vector stencils for drawing Area Charts (area graphs) that visualize changes in values by filling in the area beneath the line connecting data points.
- Design elements - Area charts | Line Chart Template for Word | Pie ...
- Area chart template
- Area chart - Template
- Design elements - Area charts | Area Charts | Basic Area Charts ...
- Meter Dashboard | What is a Dashboard Area | Gauge Chart ...
- Line Chart Templates
- Area Charts | Picture Graphs | Flowchart Examples and Templates ...
- Arrow circle chart - Template | Pie Chart Examples and Templates ...
- Pie Chart Word Template
- Line Chart Template for Word | Basic Diagramming | Line Charts ...
- How to Draw an Organization Chart | Organization Chart Templates ...
- Donut Chart Templates | Flow chart Example. Warehouse Flowchart ...
- Area charts - Vector stencils library | How to Draw an Area Chart in ...
- Line Chart Template for Word | Organizational Chart Templates ...
- Line Chart Template for Word | Chart Maker for Presentations ...
- Step Area Graph | How to Draw a Line Graph | Area Chart | The ...
- PERT chart - Template | Program Evaluation and Review Technique ...
- How to Draw an Area Chart in ConceptDraw PRO | Area Charts ...
- Line Chart Template for Word
- Seating Chart Template