Organizational Chart Templates
ConceptDraw offers you a number of ready-made organizational chart templates which you can use in your drawing. They are grouped in topical sets as organizational chart template files. Use the Organizational Charts Solution for ConceptDraw PRO to create your own Organizational Charts of any complexity quick, easy and effective. The Organizational Charts designed with ConceptDraw PRO are vector graphic documents and are available for reviewing, modifying, converting to a variety of formats (image, HTML, PDF file, MS PowerPoint Presentation, Adobe Flash or MS Visio XML), printing and send via e-mail in one moment.
Stakeholder Onion Diagram Template
For depicting the onion model are actively used Stakeholder Onion Diagrams. The ConceptDraw PRO diagramming and vector drawing software extended with Stakeholder Onion Diagrams Solution from the Management Area of ConceptDraw Solution Park offers the number of useful tools and Stakeholder Onion Diagram template for their easy design.Seating Chart Template
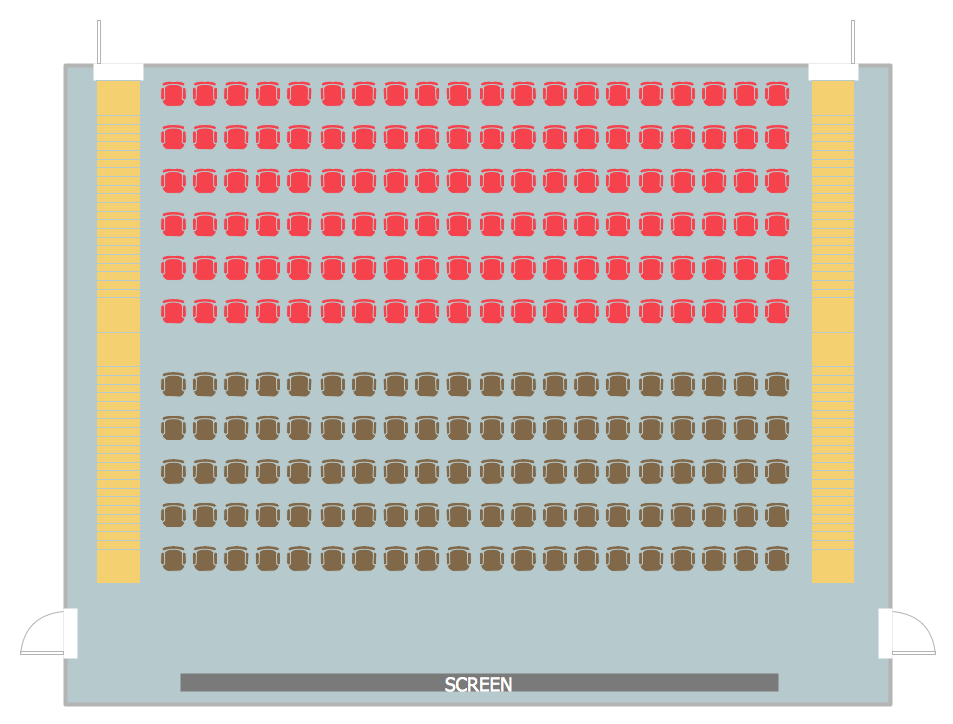
Seating chart developing is necessity for constructing and building the cinemas, theaters, banquet halls, auditoriums, and other premises for accommodation a large number of people. Seating chart template can help you design professional looking seating plan. ConceptDraw PRO diagramming and vector drawing software recommends you to use the Seating Plans solution from the Building Plans area for designing the seating charts.Pie Chart Examples and Templates
A pie chart or a circle graph is a circular chart divided into sectors, illustrating numerical proportion. In a pie chart, the arc length of each sector and consequently its central angle and area, is proportional to the quantity it represents. Pie chart examples and templates created using ConceptDraw PRO software helps you get closer with pie charts and find pie chart examples suite your needs.HelpDesk
How to Add a Block Diagram to a PowerPoint Presentation
A block diagram is a useful tool both in designing new processes, and in improving existing. A block diagram is a type of chart, which is often used in presentations, because of its universality - the graphic blocks can be applied to many processes.The PowerPoint presentation of major process steps and key process participants can be very informative and helpful. Using ConceptDraw PRO, you can easily convert a block diagram to MS PowerPoint presentation.Table Seating Chart Template
The arrangement of tables and seating charts near them have great value in many premises and situations. It is often very convenient to draw a plan before the furniture arrangement. ConceptDraw PRO software offers the Seating Plans solution from the Building Plans area for fast and easy drawing the table seating chart template and samples.HelpDesk
How to Add a Bubble Diagram to PowerPoint Presentation
Bubble diagrams can be used to compare concepts, and identify areas of similarity and difference. ConceptDraw PRO allows you to make a MS PowerPoint Presentation from your charts in a few simple steps.Process Flowchart
The main reason of using Process Flowchart or PFD is to show relations between major parts of the system. Process Flowcharts are used in process engineering and chemical industry where there is a requirement of depicting relationships between major components only and not include minor parts. Process Flowcharts for single unit or multiple units differ in their structure and implementation. ConceptDraw PRO is Professional business process mapping software for making Process flowcharts, Process flow diagram, Workflow diagram, flowcharts and technical illustrations for business documents and also comprehensive visio for mac application. Easier define and document basic work and data flows, financial, production and quality management processes to increase efficiency of your business with ConcepDraw PRO. Business process mapping software with Flowchart Maker ConceptDraw PRO includes extensive drawing tools, rich examples and templates, process flowchart symbols and shape libraries, smart connectors that allow you create the flowcharts of complex processes, process flow diagrams, procedures and information exchange. Process Flowchart Solution is project management workflow tools which is part ConceptDraw Project marketing project management software. Drawing charts, diagrams, and network layouts has long been the monopoly of Microsoft Visio, making Mac users to struggle when needing such visio alternative like visio for mac, it requires only to view features, make a minor edit to, or print a diagram or chart. Thankfully to MS Visio alternative like ConceptDraw PRO software, this is cross-platform charting and business process management tool, now visio alternative for making sort of visio diagram is not a problem anymore however many people still name it business process visio tools.
Line Chart Template for Word
This sample was created in ConceptDraw PRO diagramming and vector drawing software using the Line Graphs Solution from Graphs and Charts area of ConceptDraw Solution Park. This sample shows the Line Chart of annual percentage change. The Line Chart allows you to clearly see the changes of data over the time.
 25 Typical Orgcharts
The 25 Typical Orgcharts solution contains powerful organizational structure and organizational management drawing tools, a variety of professionally designed organization chart and matrix organization structure samples, 25 templates based on various orga
Spider Chart Template
This sample shows the Spider Chart that represents the budget and spending for one organization and allows to compare them. The multivariate data are represented on the Spider Chart as a two-dimensional chart with four or more variables displayed on the axes that start in one point. The Spider Charts are used in the management, business and sport.Matrix Organization Structure
Matrix organizational structure is one of the main forms of structures which is actively used by organizations to carry forth the functions of a company visually and effectively. Now we have ConceptDraw PRO diagramming and vector drawing software extended with 25 Typical Orgcharts solution from the Management area of ConceptDraw Solution Park which will help easy represent matrix organizational structure of any degree of complexity.Cisco Network Templates
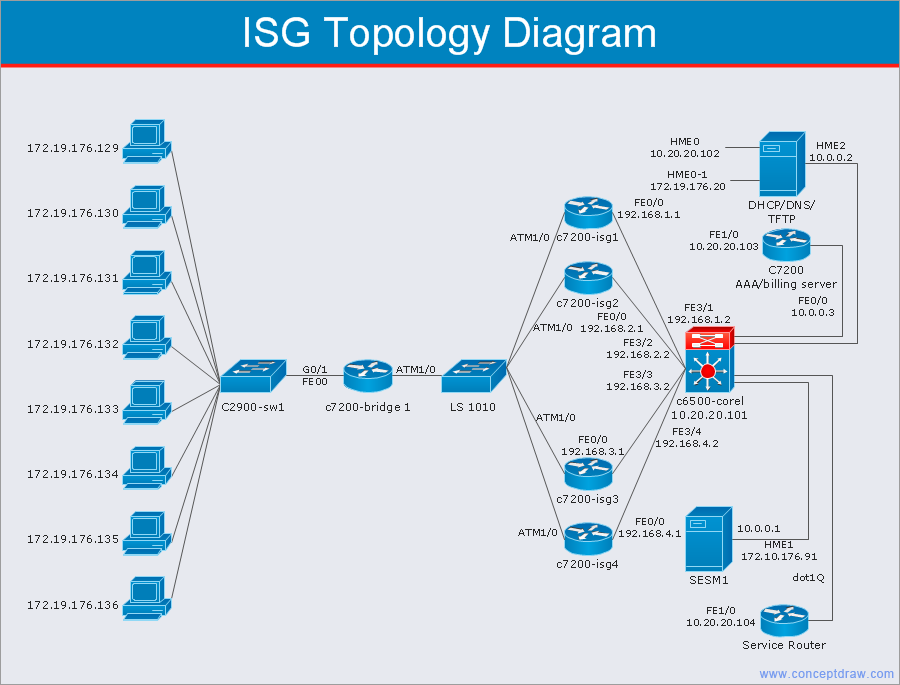
Cisco is a huge multinational company that develops and sells worldwide the]network equipment, mainly for large organizations and telecommunication companies. So, it has large number of enterprise clients in a corporate environment. Therefore many network engineers often draw the Network diagrams for Cisco hardware and are needed in a powerful vector drawing software. ConceptDraw PRO is ideal for this goal, enhanced with professional Cisco Network Diagrams solution from Computer and Networks area of ConceptDraw Solution Park it offers a wide variety of vector design objects libraries, samples and also large set of Cisco network templates. The use of templates is the easiest and time-saving way of drawing professional-looking diagrams and schematics. Use them to design Cisco Network Topologies, Cisco Network Diagrams, Cisco ISG Topology Diagrams, Cisco Express Forwarding Diagrams, Rack Diagrams, Network Organization Charts, Wireless Computer Network Diagrams, Vehicular Network Diagrams, and many other types of diagrams without efforts.
Organizational Chart Template
Organizational Charts help to show the relationships of positions within an organization in terms of authority and responsibility. They typically give an actual and clear “snapshot” picture of an organization for both employees and individuals outside, they visually show divisions of work, levels of management, and reporting relationships. ConceptDraw PRO graphical software supplied with Organizational Charts Solution from the Management Area of ConceptDraw Solution Park offers a number of ready-made organizational chart samples, examples and templates, which you can use as a foundation in your drawing. All they are grouped in topical sets as organizational chart template files and allow easily depict a wide array of organizational structure types, and to represent any business organizational structure, matrix organization structure, or functional structure. Inside the Organizational Charts solution you will find also a set of vector shape libraries containing a lot of icons needed for effective illustration the Organizational Structure Charts of any complexity.Organization Chart Templates
Organization Chart Templates - Organizational Charts Solution from the Management Area of ConceptDraw Solution Park provides a wide collection of predesigned templates and samples that will help you create the Organizational Charts of any complexity in one moment.- Powerpoint Organization Chart Template
- Chart Templates For Powerpoint
- Organizational Chart Templates | Horizontal Org Flow Chart ...
- Line Graph Templates Ppt
- Org Chart Ppt Template
- Matrix Organization Structure | Organizational Chart Templates ...
- Powerpoint Bar Chart Templates
- How to Add a Bubble Diagram to a PowerPoint Presentation Using
- Powerpoint Chart Templates
- How To Do A Mind Map In PowerPoint | Organizational Chart ...
- Powerpoint Chart Templates Free
- Donut Chart Templates Powerpoint
- Ppt Template Free Download
- Organizational Chart Templates | Network Diagram Examples ...
- Bubble Charts | Bubble Map Maker | Bubble Chart | Template Ppt ...
- Organizational Chart Templates | How To Do A Mind Map In ...
- Organizational Chart Templates | Balanced Scorecard Software ...
- Organizational Chart Templates | Dashboard | Horizontal Org Flow ...
- Powerpoint Gantt Chart Template


