Basic Flowchart Symbols and Meaning
Flowcharts are the best for visually representation the business processes and the flow of a custom-order process through various departments within an organization. ConceptDraw PRO diagramming and vector drawing software extended with Flowcharts solution offers the full set of predesigned basic flowchart symbols which are gathered at two libraries: Flowchart and Flowcharts Rapid Draw. Among them are: process, terminator, decision, data, document, display, manual loop, and many other specific symbols. The meaning for each symbol offered by ConceptDraw gives the presentation about their proposed use in professional Flowcharts for business and technical processes, software algorithms, well-developed structures of web sites, Workflow diagrams, Process flow diagram and correlation in developing on-line instructional projects or business process system. Use of ready flow chart symbols in diagrams is incredibly useful - you need simply drag desired from the libraries to your document and arrange them in required order. There are a few serious alternatives to Visio for Mac, one of them is ConceptDraw PRO. It is one of the main contender with the most similar features and capabilities.
 Sales Flowcharts
The Sales Flowcharts solution lets you create and display sales process maps, sales process workflows, sales steps, the sales process, and anything else involving sales process management.
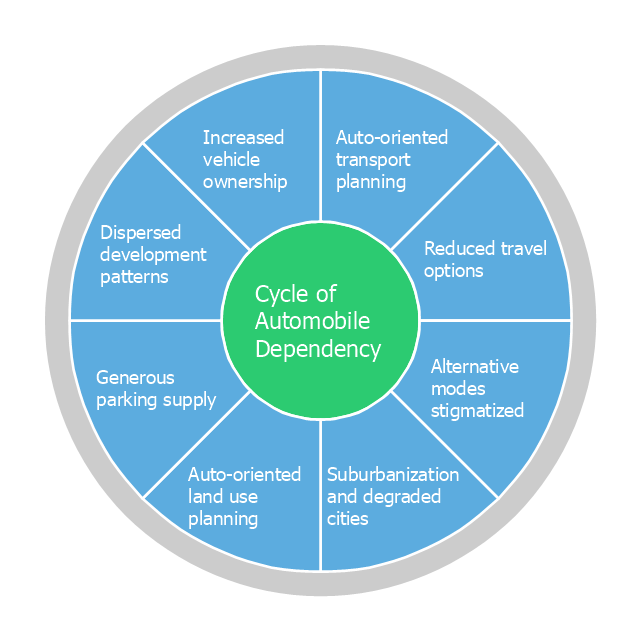
This circle pie chart sample was created on the base of the figure illustrating the article "Impacts of Parking Strategies" from the Chicago Metropolitan Agency for Planning website. "Todd Litman's "Cycle of Automobile Dependency" shows how auto-centric land use planning and excessive parking supply have created this situation. Parking management strategies can be used to break this cycle, by changing development patterns and improving travel options (2006)." [cmap.illinois.gov/ about/ 2040/ supporting-materials/ process-archive/ strategy-papers/ parking/ impacts-of-parking-strategies]
The circle pie chart example "Cycle of automobile dependency" was created using the ConceptDraw PRO diagramming and vector drawing software extended with the Target and Circular Diagrams solution from the Marketing area of ConceptDraw Solution Park.
www.conceptdraw.com/ solution-park/ marketing-target-and-circular-diagrams
Sales Process
ConceptDraw PRO is effective software for a variety of activity fields. Now, extended with Sales Flowcharts solution from the Marketing area of ConceptDraw Solution Park it become also useful in the field of sales. It helps to design professional looking Sales Flowcharts, Sales Process Flowcharts, Sales Process Maps, Plans and Diagrams to effectively realize the process of selling a product or service, and to display the sales results.Sales Process Steps
Sales process engineering is a complex and labour-intensive process which requires a lot of time, efforts, and powerful software. We recommend to use the ConceptDraw PRO software enhanced with Sales Flowcharts solution from the Marketing area of ConceptDraw Solution Park. It gives the possibility to easy illustrate all sales process steps and their results.
 Business Package for Management
Package intended for professional who designing and documenting business processes, preparing business reports, plan projects and manage projects, manage organizational changes, prepare operational instructions, supervising specific department of an organization, workout customer service processes and prepare trainings for customer service personal, carry out a variety of duties to organize business workflow.
Entity Relationship Diagram Examples
Creation of Entity-Relationship (ER) model is a visual representation the structure of a business database, where data equates to entities or objects, which are linked by defined relationships expressing dependencies and requirements. By the nature, the ER model is an abstract visualization, a first step in design process towards creating a logical and functional database. ConceptDraw PRO professional software gives the ability to effectively describe a database using the Entity-Relationship model. Included to ConceptDraw Solution Park, the Entity-Relationship Diagram (ERD) solution contains the set of predesigned vector icons advocated by Chen's and Crow’s Foot notations that both can be used for data modeling and describing a database. Entity-Relationship Diagram (ERD) solution includes also helpful templates and incredibly large collection of varied Entity Relationship Diagram examples and samples offered at ConceptDraw STORE. Each of them can be used to develop your own model of a database of arbitrary complexity.
- Cycle of automobile dependency - Circle pie chart | How To Present ...
- Pie Chart Examples and Templates | Circular diagrams - Vector ...
- Global Payment Solutions | Accounting Flowcharts | Web Recurring ...
- Organizational Structure | Organogram Software | Process Flowchart ...
- Marketing and Sales Organization chart . Organization chart Example
- Invoice payment process - Flowchart | Global Payment Solutions ...
- Pyramid Chart Examples | Basic Diagramming | Bar Diagrams for ...
- Cycle of automobile dependency - Circle pie chart | Content ...
- Invoice payment process - Flowchart | Accounting Flowchart ...
- Billing Flow Chart
- Cross-Functional Flowcharts | Credit Card Processing System UML ...
- Credit Card Order Process Flowchart. Flowchart Examples | Cross ...
- Evolution of the population | Line Chart Examples | Concept Maps ...
- Cross-Functional Flowcharts | Process Flowchart | Accounting ...
- Purchasing Flowchart - Purchase Order. Flowchart Examples | Steps ...
- Daily Schedule Chart | Cloud round icons - Vector stencils library ...
- Interactive Voice Response Diagrams | VoIP call with SIM box and ...
- Sales Process Flowchart. Flowchart Examples | Invoice payment ...
- Process Manufacturing Invoice Flow Chart


