Business Diagram Software
When managing the projects, people, or networks, there are daily designed and used different types of Business diagrams, so the powerful drawing software will be very useful for this. ConceptDraw DIAGRAM with large quantity of business solutions will meet your needs and will help you convey your ideas successful and rapidly, no matter are you professional or beginner. It is the best choice for business specialists and technical professionals who need quickly and easily explore, visualize, and communicate information. ConceptDraw DIAGRAM business diagram software is the most powerful business software and relational charting software. Create advanced, completely customizable Business Process Diagrams, Business Flow Charts, Work Flow Diagrams, Organizational Charts, Audit diagrams, Marketing diagrams, Value Stream Maps, TQM diagrams, ERD diagrams, EPC diagrams, Cause and Effect diagrams, Infographics, Dashboards, and other Relational business diagrams from your data using the powerful drawing tools of ConceptDraw Solution Park.
HelpDesk
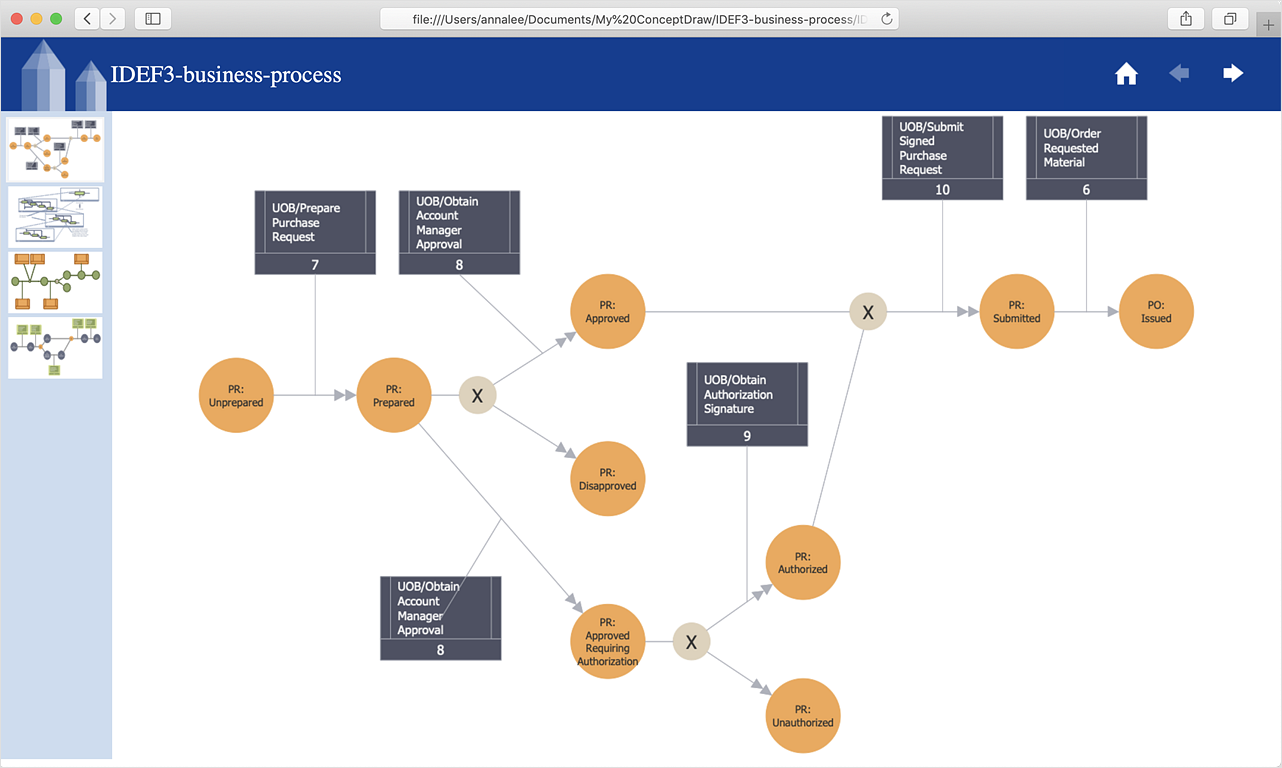
How to Save a Diagram as a Web Page
Using ConceptDraw DIAGRAM , you can save diagrams as a Web pages. ConceptDraw DIAGRAM adds the HTML tags that are needed to display your diagrams in a Web browser, so all you have to do is design their appearance.Dashboard
ConceptDraw DIAGRAM extended with Sales Dashboard solution from the Marketing area of ConceptDraw Solution Park is a perfect software for creating the live dashboard for the business data and progress visualization.Horizontal Org Flow Chart
This sample was created in ConceptDraw DIAGRAM diagramming and vector drawing software using the Organizational Charts Solution from the Management area of ConceptDraw Solution Park. The Organizational Chart is a diagram that shows the structure of the organization, different levels of management, hierarchy and the relationships of the organization parts.ConceptDraw DIAGRAM - Organizational chart software
Organizational Chart is a scheme which visualizes the composition of departments, sectors and other functional units of an organization, and also fixed relationships that exist between divisions and employees. ConceptDraw DIAGRAM enhanced with Organizational Charts solution is a powerful and cost effective Organizational chart software, which allows to automate the process of creation the high standard organizational charts, flow charts, time lines, and much more diagrams. It can be applied for analyzing organizational structure and drawing single or multi-page Organizational Charts with hyperlinks for the companies of any type, size and direction. Visualize the structure using the orgchartal tools, create easily as never before the Company Organizational Chart, Corporate Organizational Chart, Hospital Organizational Chart, University Organizational Chart, Hotel Organizational Chart, and then export, send by e-mail or publish it on Web in minutes, to communicate and discuss with colleagues or any other interested people.PERT Chart Software
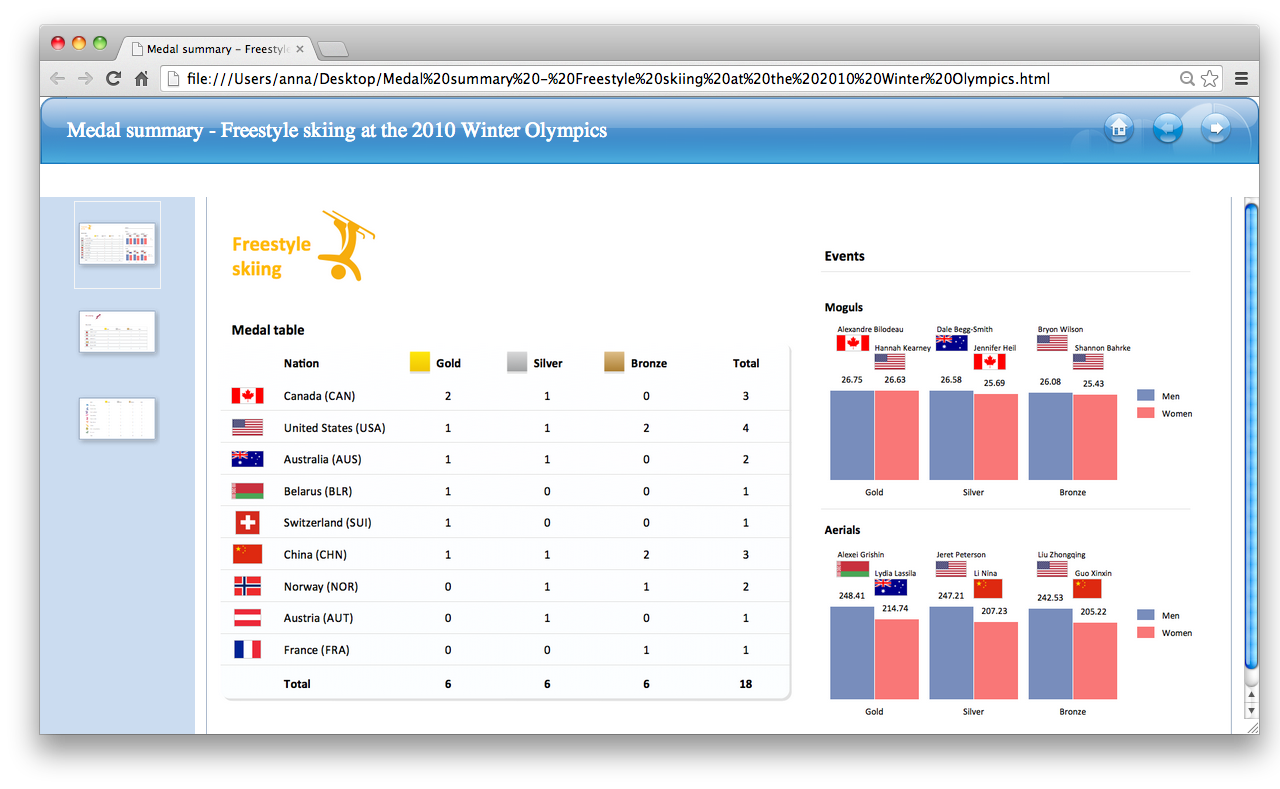
PERT Chart Software - Activity Network and Project Evaluation and Review Technique, or PERT, charts are a way of documenting and analyzing the tasks in a project. ConceptDraw DIAGRAM is a powerful diagramming and vector drawing software for designing professional looking PERT Charts quick and easy.Export from ConceptDraw DIAGRAM Document to HTML
Using ConceptDraw DIAGRAM , you can save diagrams as a Web pages. ConceptDraw DIAGRAM adds the HTML tags that are needed to display your diagrams in a Web browser, so all you have to do is design their appearance.
HelpDesk
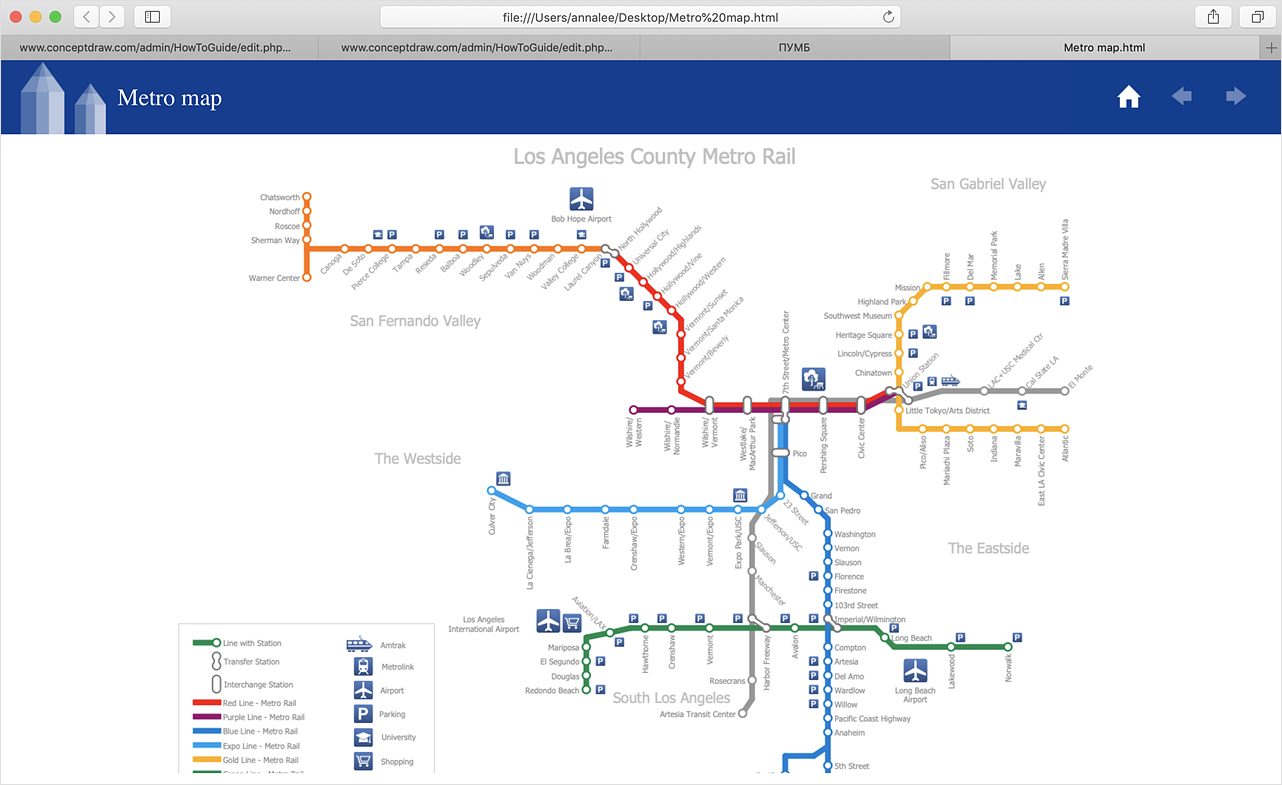
How to Make a Web Page from Your Metro Map
Using ConceptDraw DIAGRAM, you can create metro maps, route maps, and various transport schemes. It is easy for anyone to build a map, one does not need to be a cartographer to make good use of the ConceptDraw mapping solutions. Elaborate maps can be quickly assembled and then used on the web, printed, or made into signage. Graphical power and ease of use are built into the ConceptDraw mapping solutions. You can save your drawing as a Web page. ConceptDraw DIAGRAM adds the HTML tags that are needed to display your diagrams in a Web browser, so all you have to do is design their appearance.
 ConceptDraw Dashboard for Facebook
ConceptDraw Dashboard for Facebook solution extends ConceptDraw DIAGRAM software with a dynamically updated visual dashboard, which shows lifetime total likes, daily friends of fans, and daily page views, information you can receive from Facebook Insights.
HelpDesk
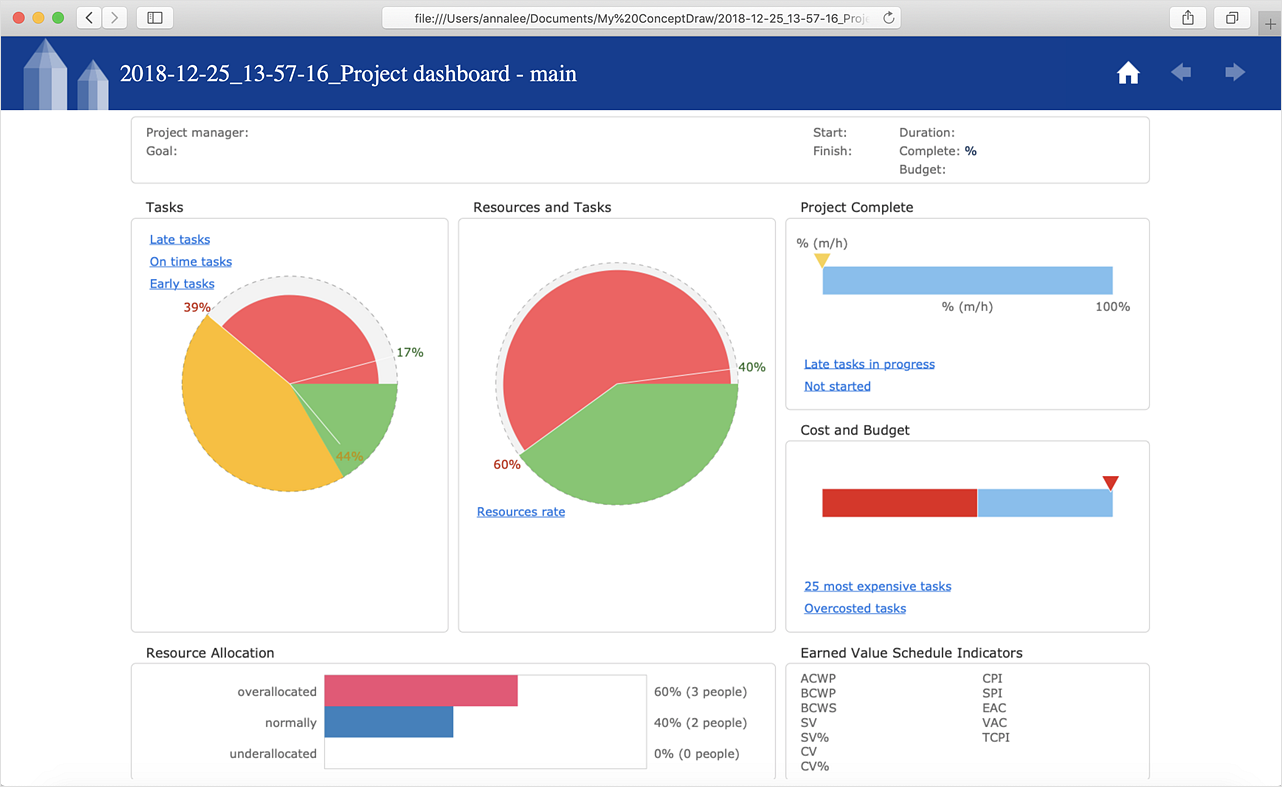
How to Publish Project Reports to a Web Site
Reporting is an important part of project management. Every project manager is regularly asked how the project is progressing. ConceptDraw Office offers different ways in which to provide a project status.Organizational Chart Templates
ConceptDraw offers you a number of ready-made organizational chart templates which you can use in your drawing. They are grouped in topical sets as organizational chart template files. Use the Organizational Charts Solution for ConceptDraw DIAGRAM to create your own Organizational Charts of any complexity quick, easy and effective. The Organizational Charts designed with ConceptDraw DIAGRAM are vector graphic documents and are available for reviewing, modifying, converting to a variety of formats (image, HTML, PDF file, MS PowerPoint Presentation, Adobe Flash or MS Visio XML), printing and send via e-mail in one moment.
Steps in the Accounting Process
Steps in the Accounting Process - The Accounting Process is a sequence of organization activities that is used for gaining quantitative information about the finances. This complex process consists of a set of sequential steps. 9 steps in the accounting process: Analysis of Business Transactions, Make Journal Entries, Post to Ledger Accounts, Prepare Trial Balance, Make Adjusting Entries, Adjusted Trial Balance, Prepare Financial Statements, Close Accounts, Post-Closing Trial Balance.Marketing Charts
ConceptDraw DIAGRAM diagramming and vector drawing software offers the Marketing Diagrams Solution from the Marketing Area with extensive drawing tools, predesigned vector shapes, templates and samples for fast and easy drawing marketing charts and diagrams, marketing schemes and flow charts, various marketing illustrations, etc.Business Report Pie. Pie Chart Examples
This sample shows the Business Report Pie Chart. The Pie Chart visualizes the data as the proportional parts of a whole, illustrates the numerical proportion. Pie Charts are very useful in the business, statistics, analytics, mass media.- Dashboard Template Html
- Mind Map Html Gantt Chart
- Sales KPI Dashboards | Export from ConceptDraw PRO Document ...
- PM Dashboards | Status Dashboard | Comparison Dashboard ...
- Organizational Chart Templates | Horizontal Org Flow Chart | Sales ...
- Organizational Chart Templates | Balanced Scorecard Software ...
- Percentage Pie Chart . Pie Chart Examples | Composition ...
- Sales Growth. Bar Graphs Example | Double bar chart - Nitrate ...
- Sales Dashboard | PM Dashboards | Meter Dashboard | Transport ...
- Pie Chart Marketing Mix Products
- Export from ConceptDraw PRO Document to HTML
- Design elements - Comparison charts and indicators | Basic ...
- Double bar chart - Nitrate concentration in Community Water ...
- How to Draw a Divided Bar Chart in ConceptDraw PRO | Divided ...
- Double bar chart - Nitrate concentration in Community Water ...
- Feature Comparison Chart Software | Competitive feature ...
- Business Diagram Software | Export from ConceptDraw PRO ...
- Website launch - Flowchart | Website Wireframe | Website traffic ...
- Feature Comparison Chart Software | Financial Comparison Chart ...
- Rainfall Bar Chart | Percentage Pie Chart . Pie Chart Examples | How ...


