HelpDesk
How to Draw a Pie Chart
A pie chart represents data, in a clear and easy to read around (pie) form. A circular pie chart is divided into sections (slice). Each "slice" depicts the It reflects the proportion of each component in the whole "pie". This type of chart is most often used for the visualization of statistical data. That is why pie charts are widely used in marketing. As the pie charts show proportional parts of a whole, they are good for various visual comparisons. For example, it is difficult to imagine a more intuitive way to show segmentation and market share. ConceptDraw DIAGRAM allows you to draw a simple and clear Pie Chart using the Pie Charts solution.
 ConceptDraw Solution Park
ConceptDraw Solution Park collects graphic extensions, examples and learning materials
 Seating Plans
The Seating Plans solution including samples, seating chart templates and libraries of vector design elements assists in creating the Seating plans, Seating arrangement charts, Chair layout designs, Plan drawings of cinema seating, Movie theater chair plans, extensive Cinema theater plans depicting the seating arrangement in the cinema halls, location of closet, cafe and food sale area, in designing the Seating plans for the large seating areas, Seat plan designs for airplanes, trains, etc. Use any of the included samples as the table seating chart template or seating chart template free and achieve professional drawing results in a few minutes.
HelpDesk
How to Create a CCTV Diagram
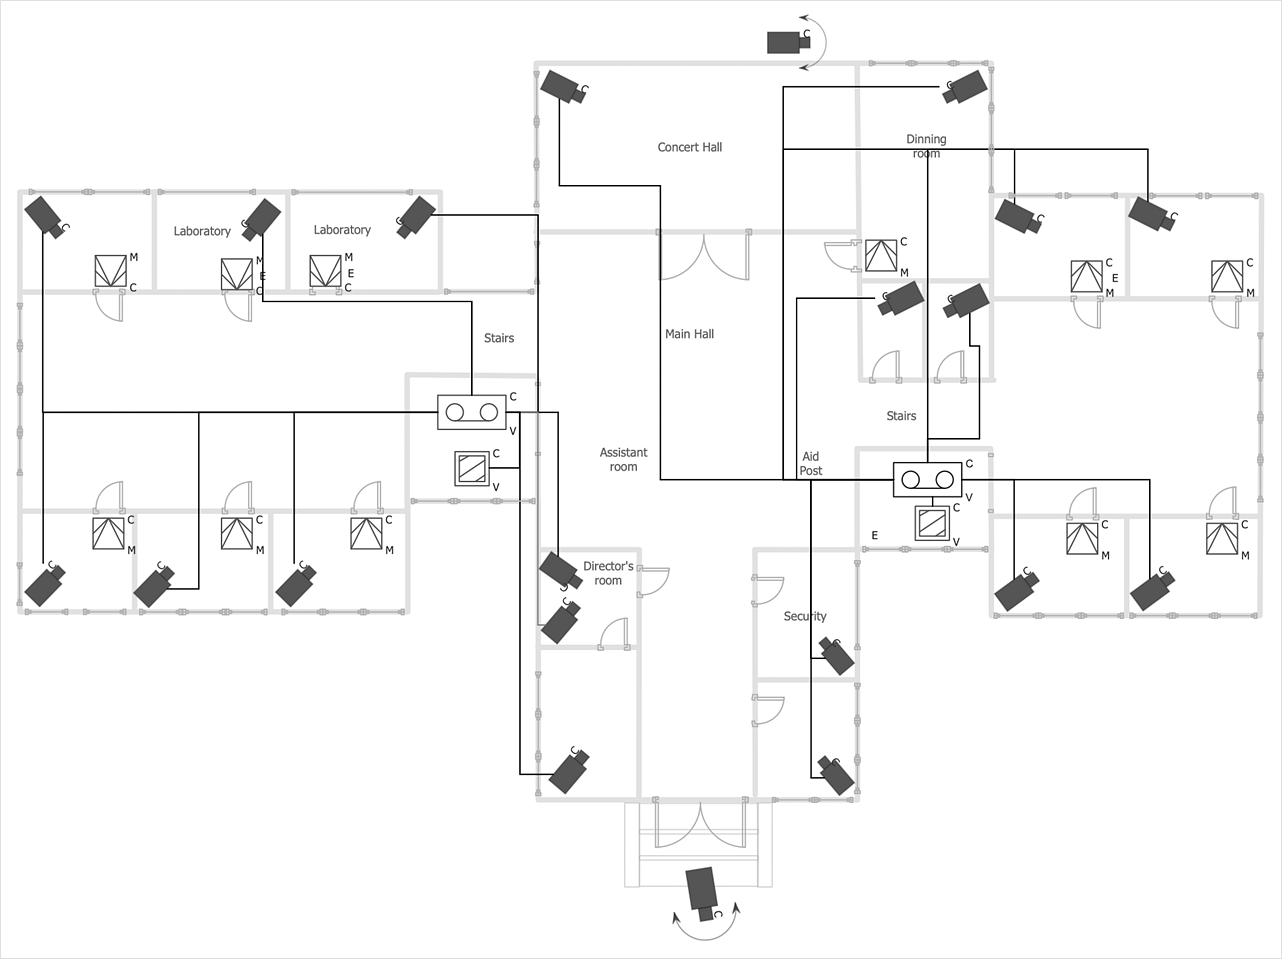
CCTV (Closed-circuit television) diagram is used to depict a system of video monitoring. The CCTV diagram provides video cameras placement strategy. CCTV diagram should include the scheme of strategic placement of video cameras, which capture and transmit videos to either a private network of monitors for real-time viewing or to a video recorder for later reference. CCTV is commonly used for surveillance and security purposes. Using ConceptDraw DIAGRAM with the Security and Access Plans Solution lets you create professional looking video surveillance CCTV system plans, security plans, and access schemes.- Fishbone Diagram Generator Free Download
- ConceptDraw Solution Park | Bar Chart Software | Polar Graph ...
- Bar Graph Generator
- Online Fishbone Diagram Generator
- ConceptDraw Solution Park | Workflow Diagram Software Mac ...
- Bar Chart Generator
- Infographic Generator | Basic Diagramming | Map Infographic ...
- Line Graphs | Picture Graphs | Bar Graphs | Online Graph Generator ...
- Pie Chart Generator Online
- Fishbone Diagram Generator Free
- Infographic Generator | How to Create a Timeline Diagram in ...
- Business Productivity Diagramming | Business Productivity ...
- How to Create a Timeline Diagram in ConceptDraw PRO ...
- Entity-Relationship Diagram (ERD) | Word Document Generator
- Diagram Generator
- Diesel Generator Working Flow Chart
- Generator Diagram
- Diagram Of Generator
- ConceptDraw Solution Park | Fishbone Diagram | PM Personal Time ...

