 Chemistry
This solution extends ConceptDraw PRO software with samples, template and libraries of vector stencils for drawing the Chemistry Illustrations for science and education.
Basic Diagramming
Mathematics is an exact science, which studies the values, spatial forms and quantitative relations. It is a science, in which is built large number of various diagrams, charts and graphs that present the material in a clear, visual and colorful form, help to analyze the information and to make certain conclusions. A diagram is a graphical representation of data using the linear segments or geometric shapes, which allows to evaluate the ratio of several values. Depending on the types of solved tasks are used the diagrams of different kinds. A graph is a diagram that shows quantitative dependencies of various processes using the curves. ConceptDraw PRO is a powerful intelligent and multifunctional vector engine for drawing different Mathematical diagrams and graphs, Mathematical illustrations, complex and simple Diagram mathematics, Flowcharts of equation solving process, Line graphs, Scatter plots, Histograms, Block diagrams, Bar charts, Divided bar diagrams, Pie charts, Area charts, Circular arrows diagrams, Venn diagrams, Bubble diagrams, Concept maps, and many others.
Basic Diagramming Flowchart Software
ConceptDraw PRO is a powerful intelligent vector graphics tool for drawing flowcharts.Aerospace - Design Elements
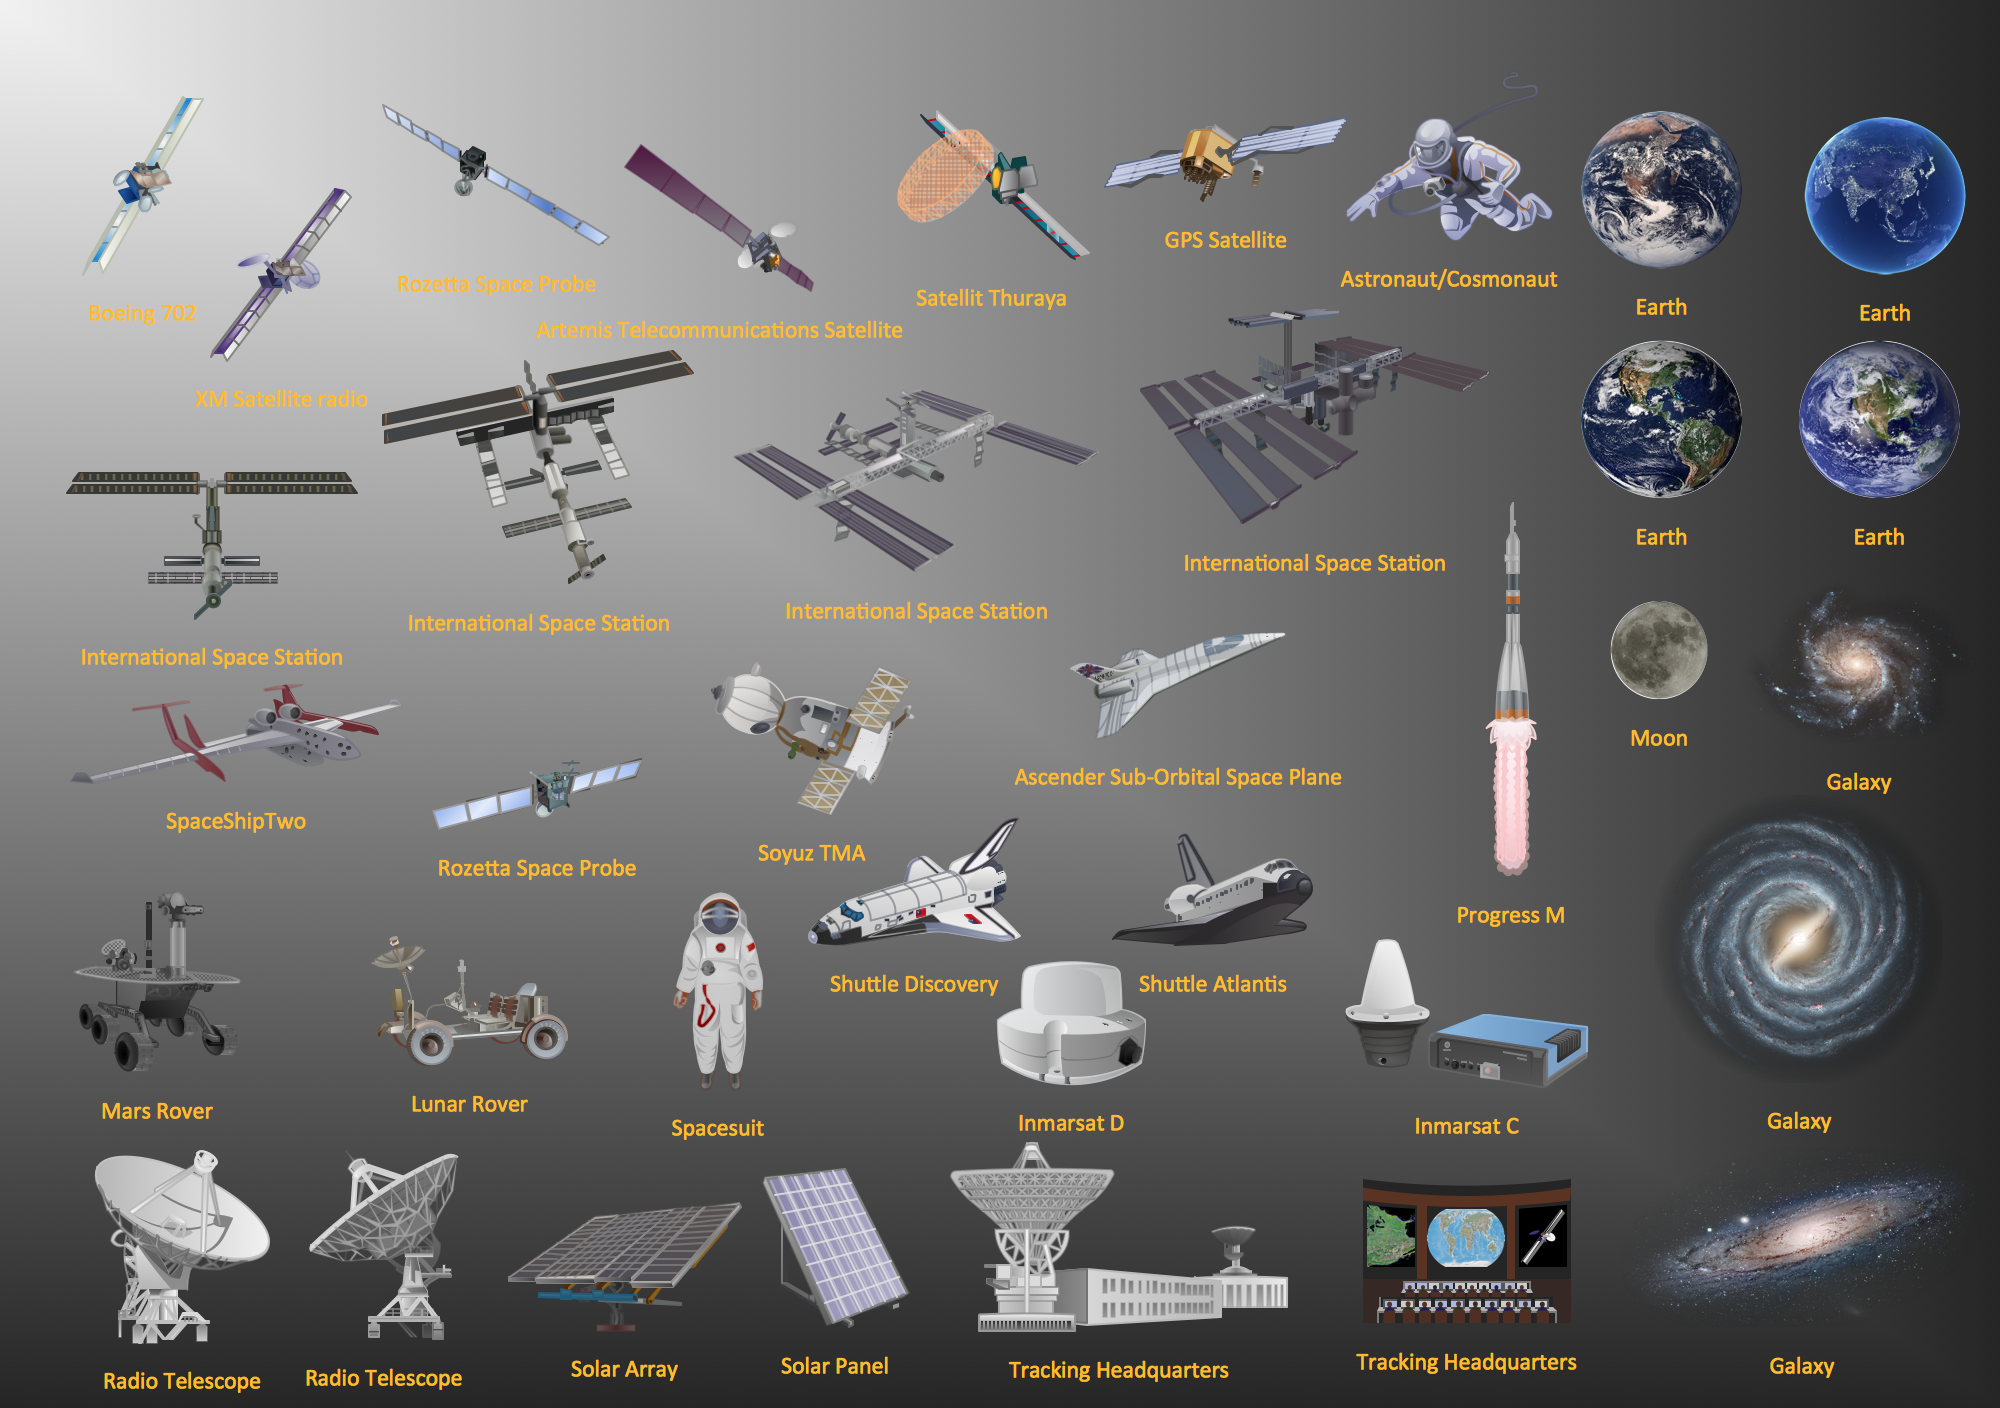
Samples, templates and libraries contain vector clip art for drawing the Aerospace Illustrations.Mathematical Diagrams
ConceptDraw PRO diagramming and vector drawing software extended with Mathematics solution from the Science and Education area is the best for creating: mathematical diagrams, graphics, tape diagrams various mathematical illustrations of any complexity quick and easy. Mathematics solution provides 3 libraries: Plane Geometry Library, Solid Geometry Library, Trigonometric Functions Library.
 GHS Hazard Pictograms
GHS Hazard Pictograms solution contains the set of predesigned standard GHS pictograms, Hazardous symbols, and Hazard communication pictograms, approved and agreed by UN in Globally Harmonized System of Classification and Labelling of Chemicals (GHS). They can be used for quick and simple designing accurate and professional-looking infographics, diagrams, warning announcements, signboards, posters, precautionary declarations, regulatory documents, and for representing the main items of OSHA HAZCOM Standard.
- Chemistry Formula Chart Download
- Percentage Pie Chart . Pie Chart Examples | Atmosphere air ...
- Chemistry Formula Chart In Hd
- Chemistry Equation Symbols | Basic Diagramming | Physics ...
- Hd Images Chart Of Chemistry Formulas
- How To Draw A Flow Chart Of Chemical Equation
- Basic Diagramming | Chemistry Equation Symbols | Solving ...
- Formulas Of Flowchart Formulas Of Flow Chart
- Chemistry Drawings | How to Create a Scatter Chart | Picture Graphs ...
- Basic Diagramming | Solving quadratic equation algorithm ...
- Solving quadratic equation algorithm - Flowchart | Chemistry ...
- Science Chart Formula
- Chemistry Drawings | Chemistry Equation Symbols | Chemistry ...
- Design To Make A Chart Of Chemical Reactions
- Geo Map - Asia - Philippines | Bar Diagram Math | UK Map | Natural ...
- Pie Charts | Divided Bar Diagrams | Manufacturing and Maintenance ...
- Energy resources diagram | Types of Flowcharts | Pie Charts ...
- Formula For Production Flow Chart
- Solving quadratic equation algorithm - Flowchart | Chemistry ...
- LLNL Flow Charts | Chemical Engineering | Pyramid Charts | Images ...


