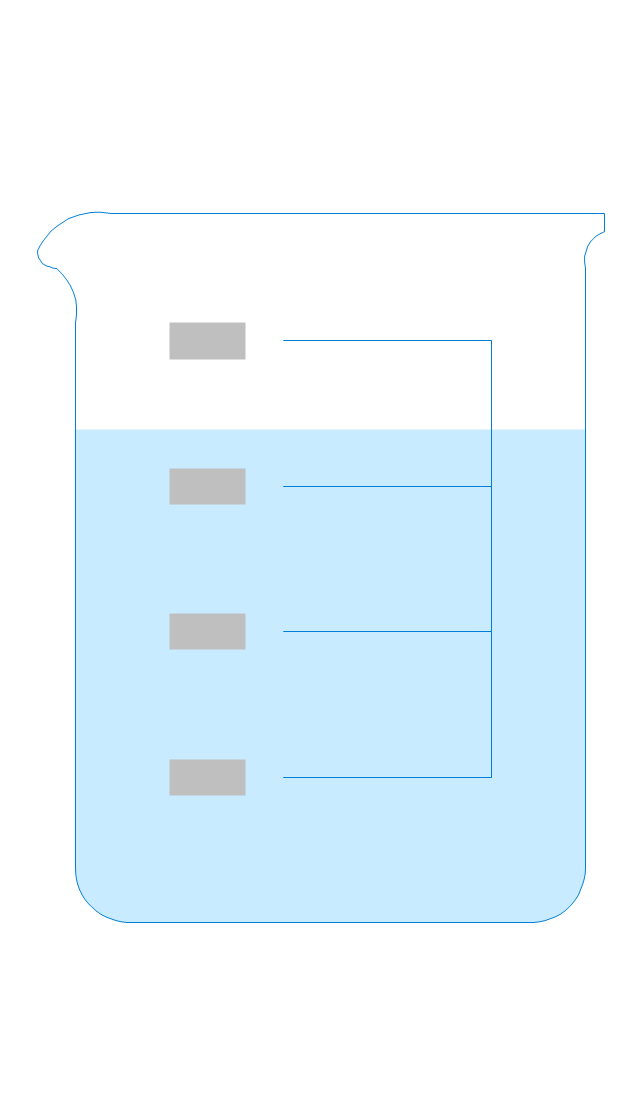
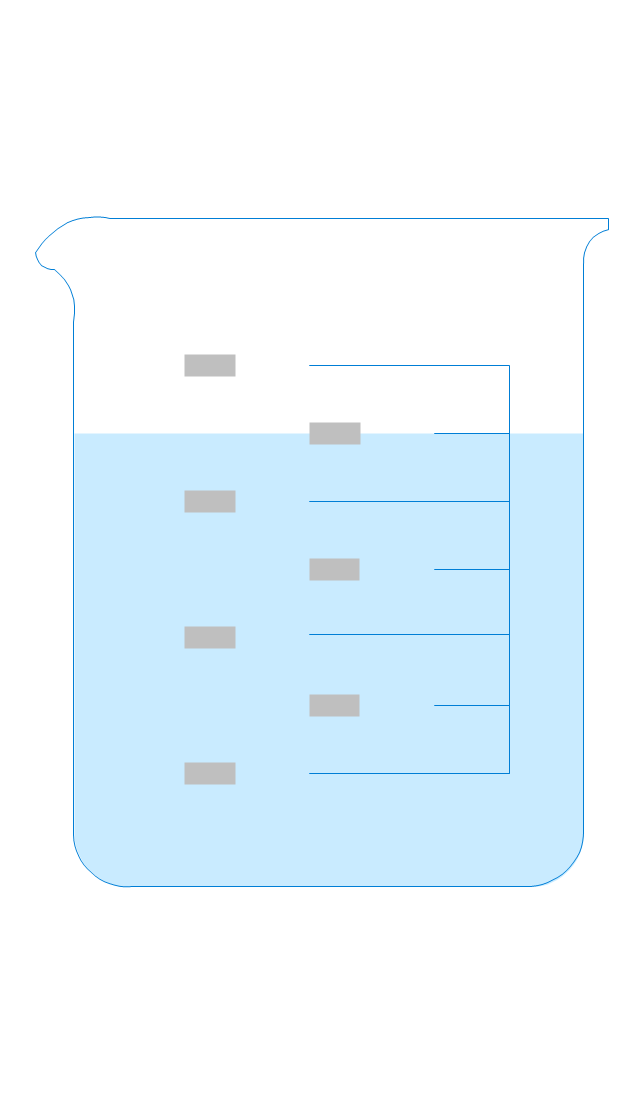
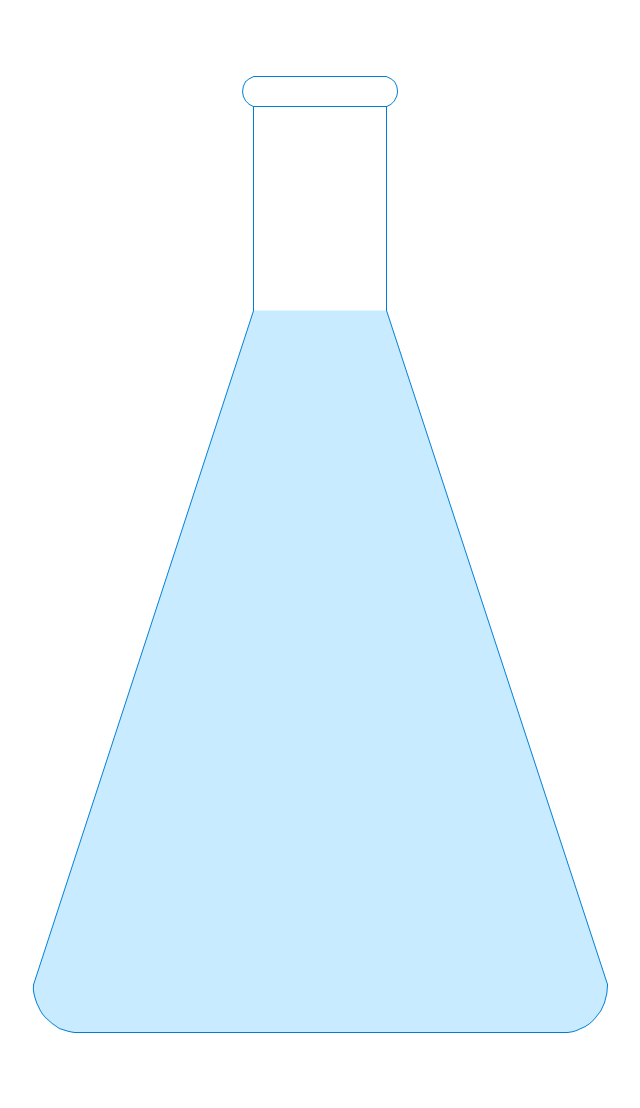
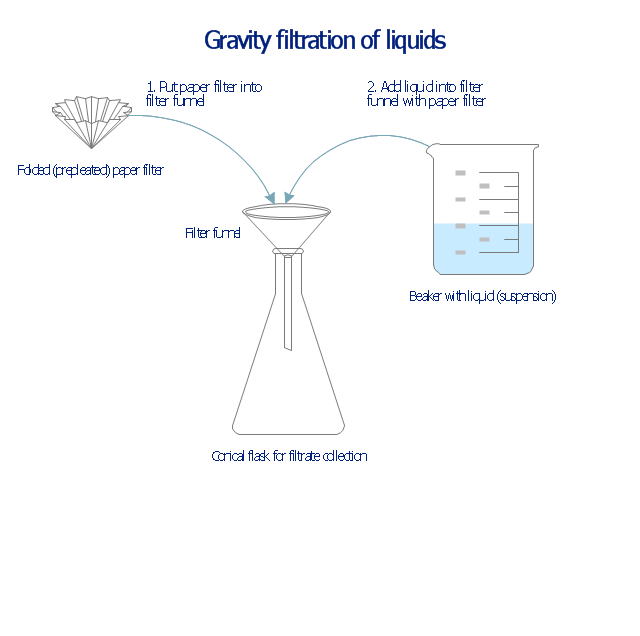
This chemical laboratory technique drawing depict gravity filtration of liquid through prepleated paper filter step-by-step.
1. Put folded filter paper cone into glass filter funnel inserted into neck of conical (Erlenmeyer) flask.
2. Add liquid suspension from the glass beaker with a spout into the funnel with paper filter.
3. Collect filtrate in the conical flask and solid on the paper filter in the funnel.
"Filtration is commonly the mechanical or physical operation which is used for the separation of solids from fluids (liquids or gases) by interposing a medium through which only the fluid can pass. The fluid that pass through is called a filtrate. Oversize solids in the fluid are retained, but the separation is not complete; solids will be contaminated with some fluid and filtrate will contain fine particles (depending on the pore size and filter thickness)." [Filtration. Wikipedia]
"Filter paper is a semi-permeable paper barrier placed perpendicular to a liquid or air flow. It is used to separate fine solids from liquids or air." [Filter paper. Wikipedia]
The chemical lab drawing example "Gravity filtration of liquids" was created using the ConceptDraw PRO diagramming and vector drawing software extended with the Chemistry solution from the Science and Education area of ConceptDraw Solution Park.
Chemistry Symbols and Meanings
Chemistry solution offers 5 libraries with large collection of vector chemistry symbols and meanings, chemistry equation symbols, organic chemistry symbols, and chemical clipart: Chemical Elements Library, Chemical Drawings Library, Conformations Library, Laboratory Equipment Library, Periodic Table of Chemical Elements Library.
 Chemistry
This solution extends ConceptDraw PRO software with samples, template and libraries of vector stencils for drawing the Chemistry Illustrations for science and education.
Process Flowchart
The main reason of using Process Flowchart or PFD is to show relations between major parts of the system. Process Flowcharts are used in process engineering and chemical industry where there is a requirement of depicting relationships between major components only and not include minor parts. Process Flowcharts for single unit or multiple units differ in their structure and implementation. ConceptDraw PRO is Professional business process mapping software for making Process flowcharts, Process flow diagram, Workflow diagram, flowcharts and technical illustrations for business documents and also comprehensive visio for mac application. Easier define and document basic work and data flows, financial, production and quality management processes to increase efficiency of your business with ConcepDraw PRO. Business process mapping software with Flowchart Maker ConceptDraw PRO includes extensive drawing tools, rich examples and templates, process flowchart symbols and shape libraries, smart connectors that allow you create the flowcharts of complex processes, process flow diagrams, procedures and information exchange. Process Flowchart Solution is project management workflow tools which is part ConceptDraw Project marketing project management software. Drawing charts, diagrams, and network layouts has long been the monopoly of Microsoft Visio, making Mac users to struggle when needing such visio alternative like visio for mac, it requires only to view features, make a minor edit to, or print a diagram or chart. Thankfully to MS Visio alternative like ConceptDraw PRO software, this is cross-platform charting and business process management tool, now visio alternative for making sort of visio diagram is not a problem anymore however many people still name it business process visio tools.
Biology Drawing Software
Biology is incredibly interesting and useful natural science which studies all living things on the earth (people, animals, plants), structure, functions, interactions, evolution of living organisms. Biologists of the whole world use actively illustrations and drawings in your science and education activity. To facilitate their task of biology drawing, ConceptDraw PRO diagramming and vector drawing software was extended with Biology solution from the Science and Education area. Now, ConceptDraw PRO is a powerful biology drawing software.Design Element: Basic Network for Network Diagrams
ConceptDraw PRO is perfect for software designers and software developers who need to draw Basic Network Diagrams.
Electrical Drawing Software and Electrical Symbols
Any electrical device could not be created without electrical diagram, wiring also cannot be laid without pre-designed and approved scheme or plan. Electrical drawing is a type of technical drawing that depicts scheme of some electrical device and includes the information about power, lighting, etc. Electrical plan designed for architectural or engineering project visually displays location of electrical devices and connections. ConceptDraw PRO is ideal electrical software for construction professional-looking Electrical Circuits, Electrical Schematics, Electrical Layouts, Electrical Wiring, Automotive Wiring, Cabling Layout Diagrams, Circuits and Logic Schematics, Logic Gate Diagrams, Digital Circuits, Parallel Circuits, Blue Prints with help of 926 standard electrical symbols offered by 26 libraries of Electrical Engineering solution from the Engineering area for ConceptDraw PRO. It makes drawing Electrical diagrams very easy even for beginners, and also extends your work with various export methods.Chemical Engineering
ConceptDraw PRO is a powerful diagramming and vector drawing software. Extended with Chemical and Process Engineering Solution from the Industrial Engineering Area of ConceptDraw Solution Park, it became the best Chemical Engineering software.ERD Symbols and Meanings
Entity Relationship Diagram (ERD) is a popular software engineering tool for database modeling and illustration the logical structure of databases, which uses one of two notations - Chen's or Crow’s Foot. Crow's foot notation is effective when used in software engineering, information engineering, structured systems analysis and design. Each of these notations applies its own set of ERD symbols. Crow's foot diagrams use boxes to represent entities and lines between these boxes to show relationships. Varied shapes at the ends of lines depict the cardinality of a given relationship. Chen's ERD notation is more detailed way to represent entities and relationships. ConceptDraw PRO application enhanced with all-inclusive Entity-Relationship Diagram (ERD) solution allows design professional ER diagrams with Chen's or Crow’s Foot notation on your choice. It contains the full set of ready-to-use standardized ERD symbols and meanings helpful for quickly drawing, collection of predesigned ERD samples, examples and templates. ConceptDraw Pro is a great alternative to Visio for Mac users as it offers more features and can easily handle the most demanding professional needs.
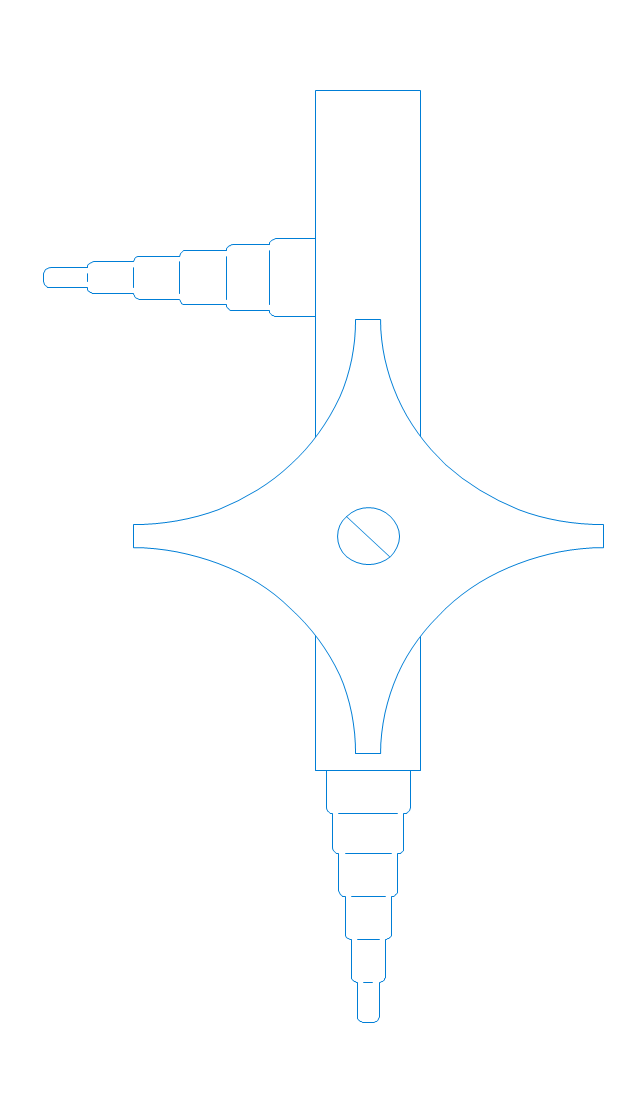
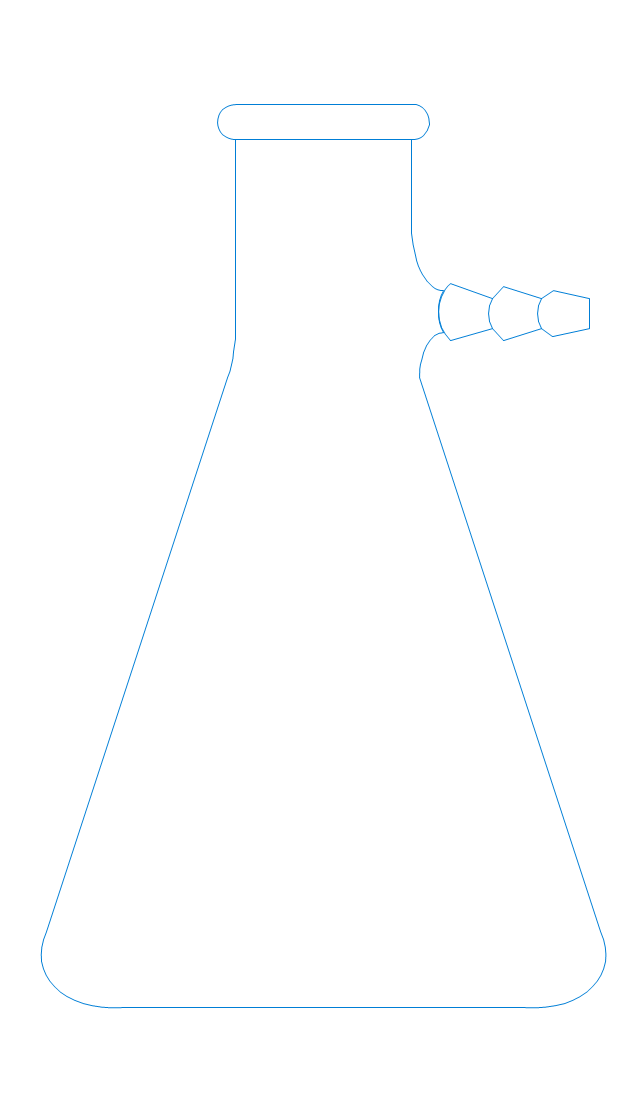
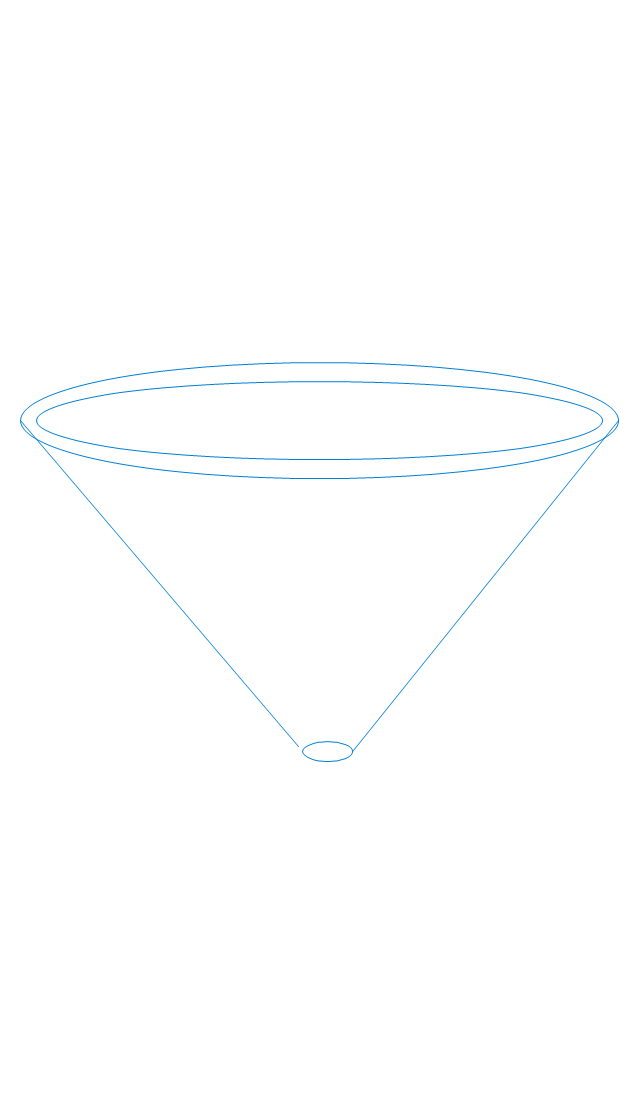
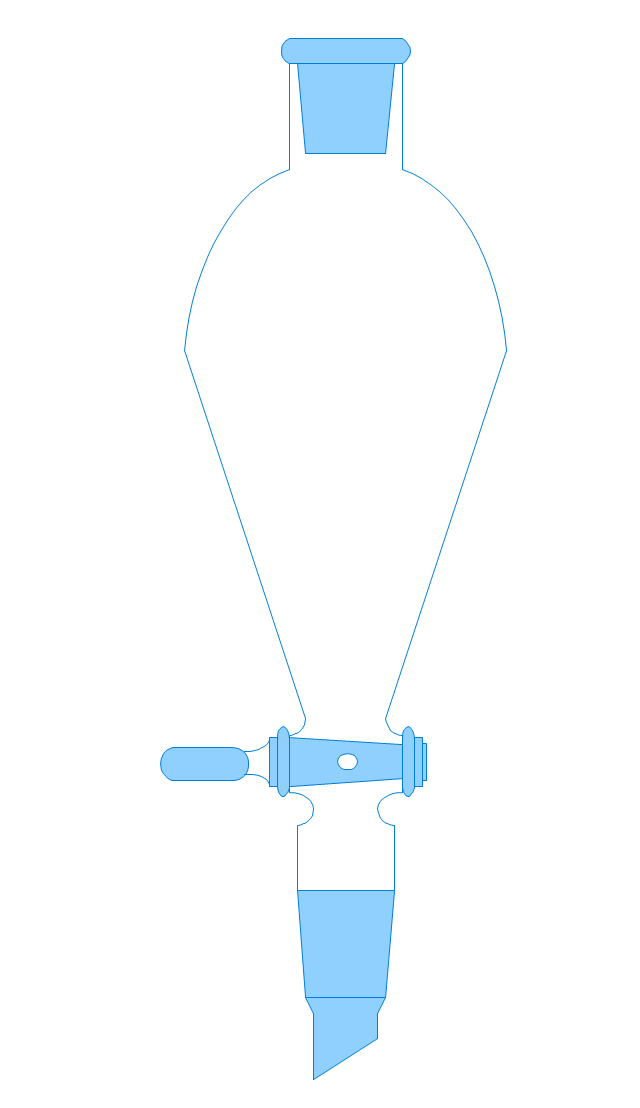
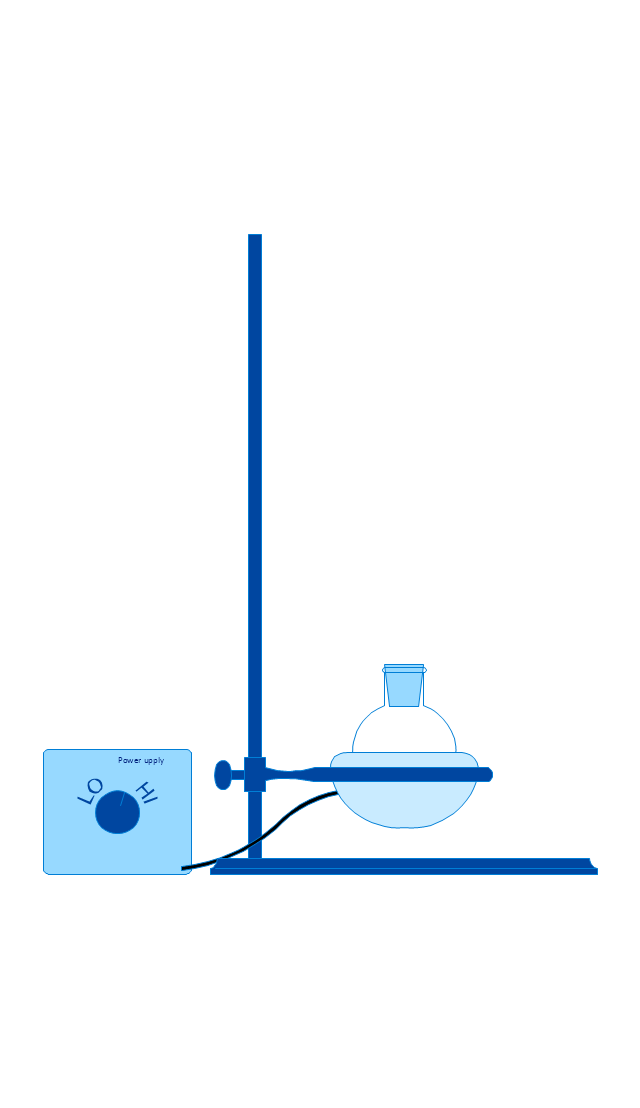
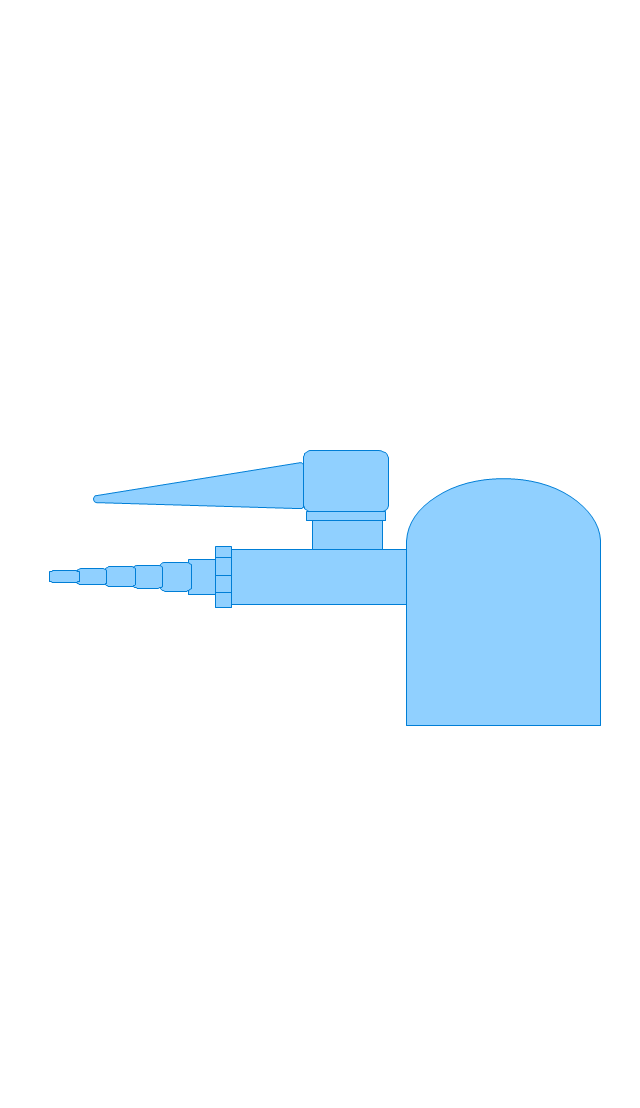
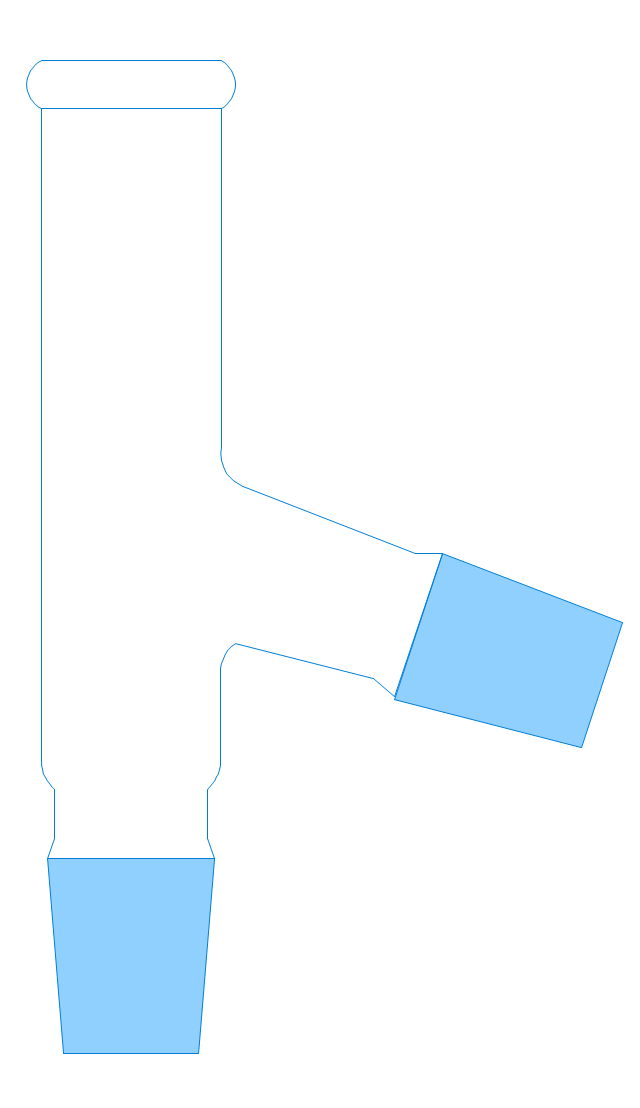
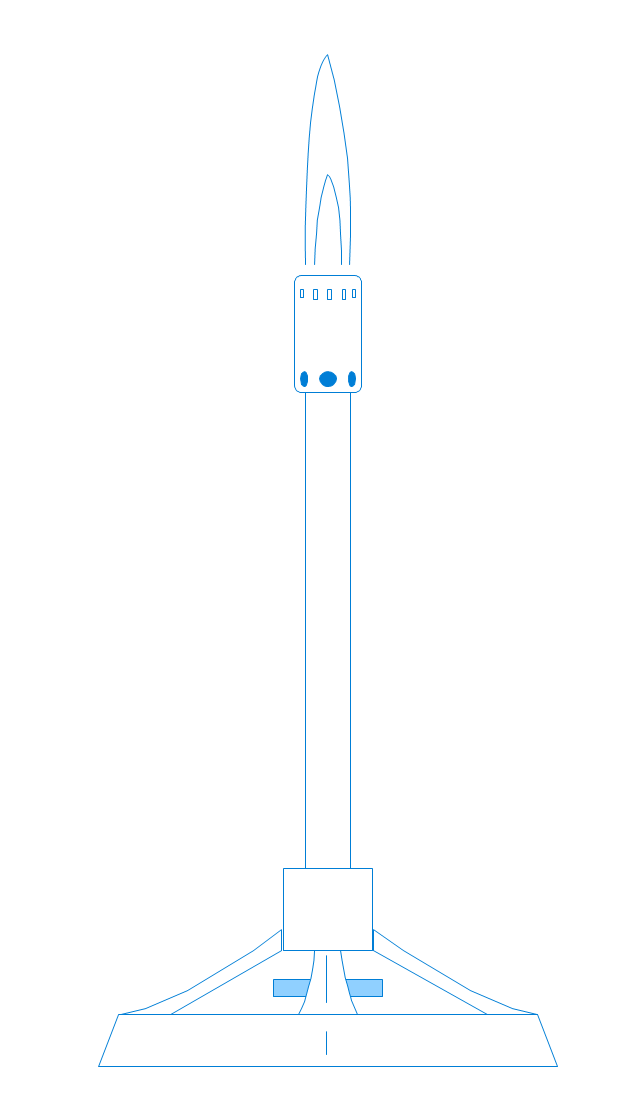
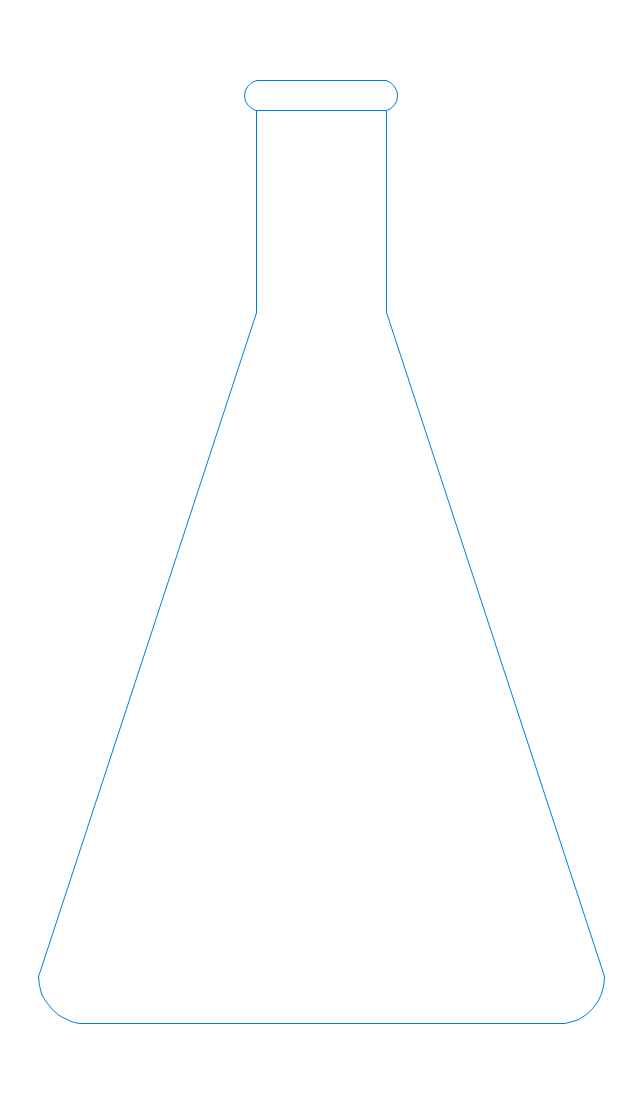
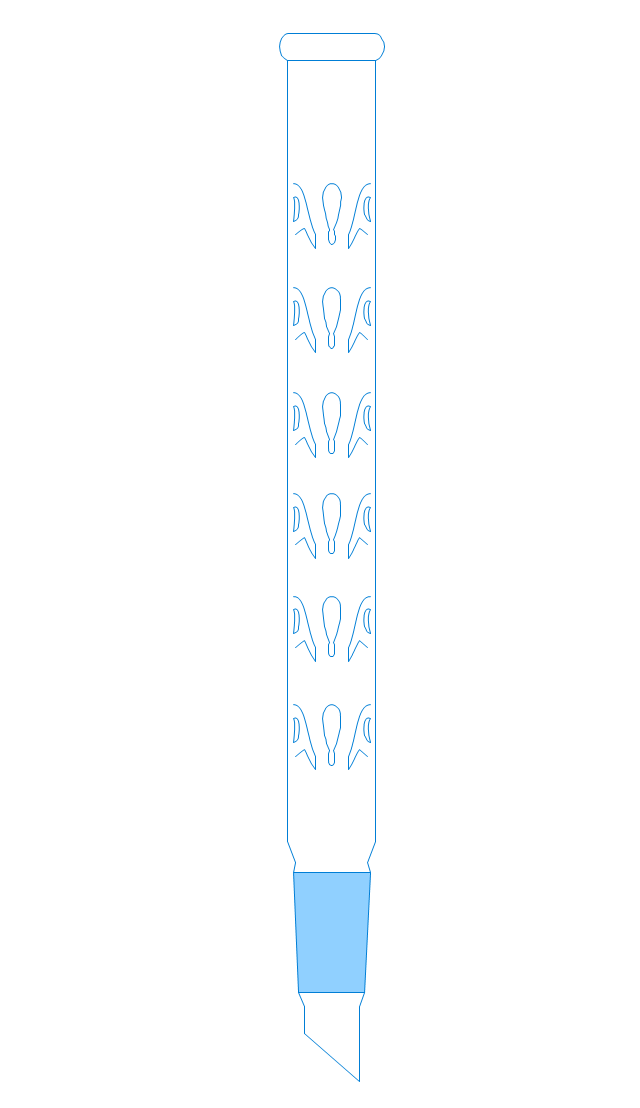
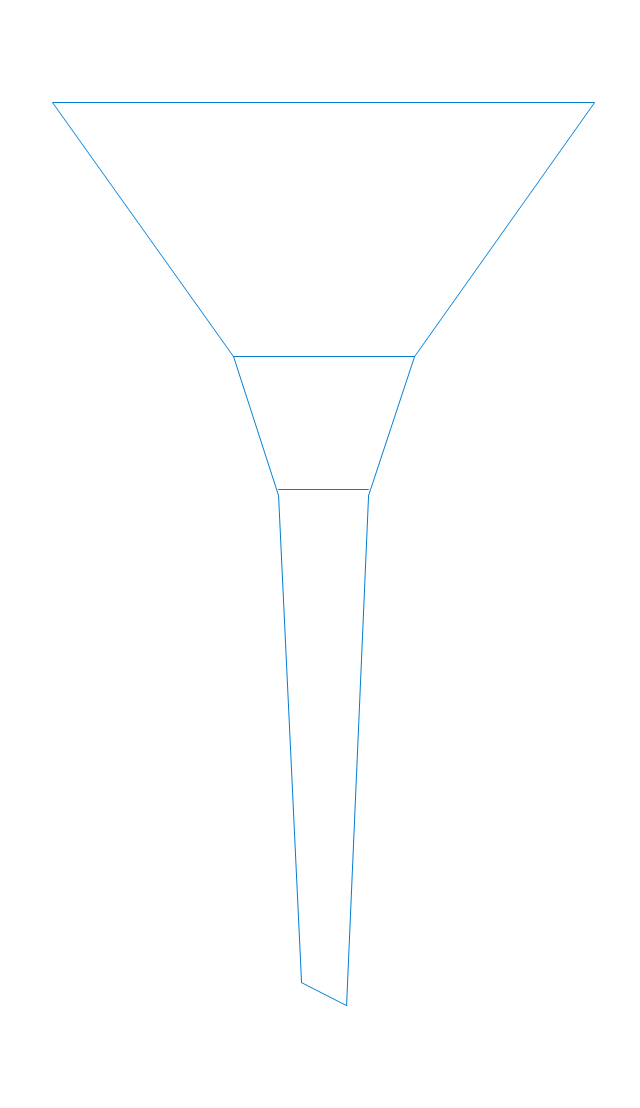
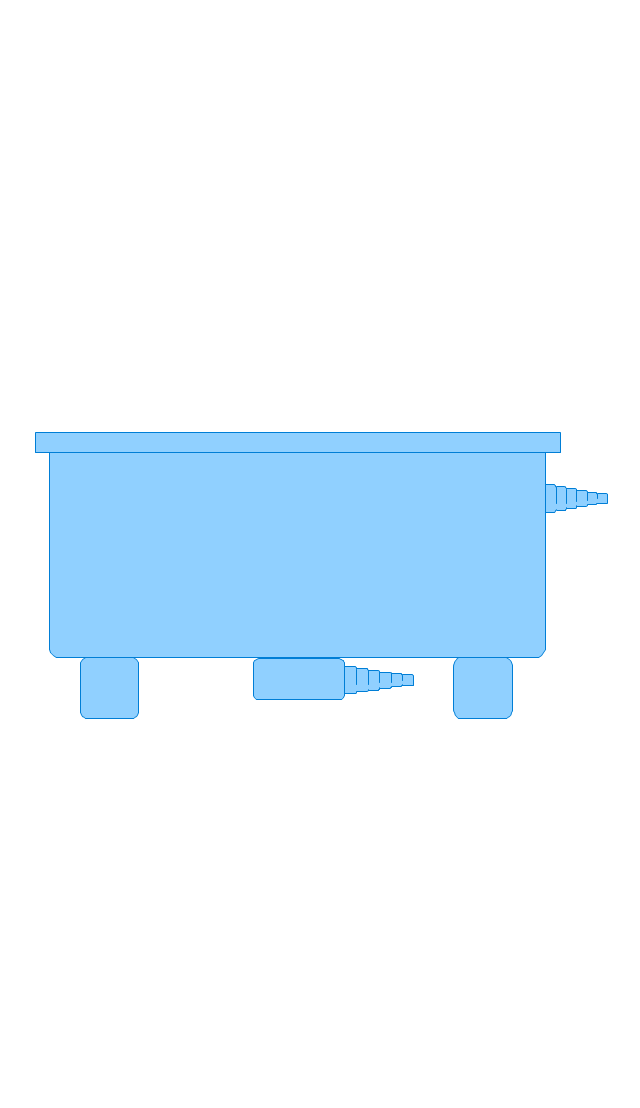
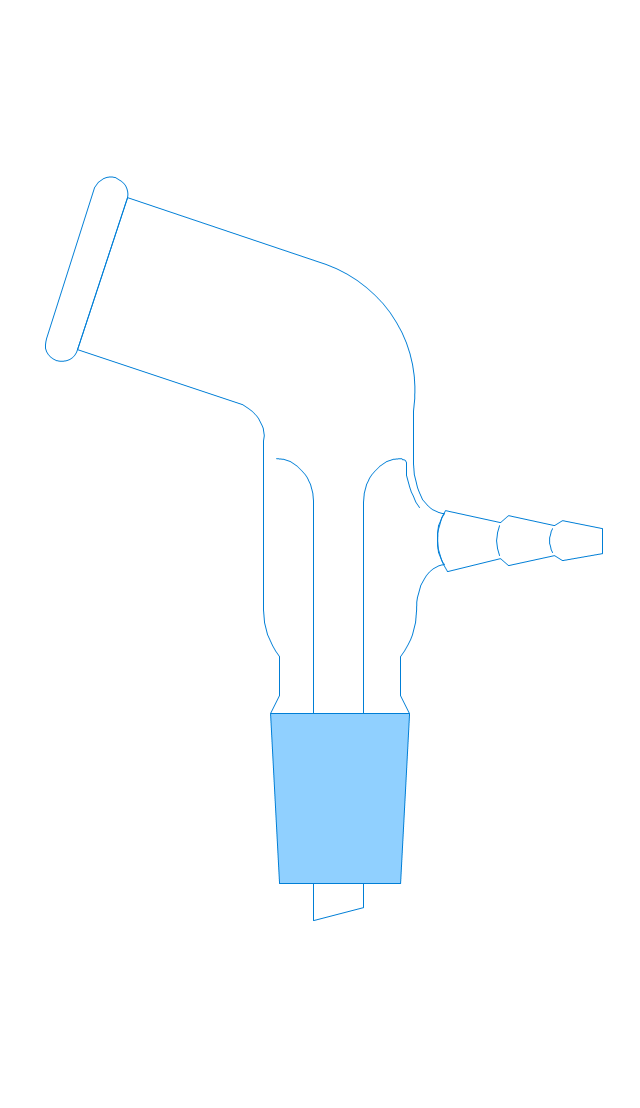
The vector stencils library "Laboratory equipment" contains 31 clipart icons of chemical laboratory equipment and labware.
Use these shapes for drawing part assembly and mounting schemes of glassware apparatus in chemical experiment diagrams and illustrations in the ConceptDraw PRO diagramming and vector drawing software extended with the Chemistry solution from the Science and Education area of ConceptDraw Solution Park.
Use these shapes for drawing part assembly and mounting schemes of glassware apparatus in chemical experiment diagrams and illustrations in the ConceptDraw PRO diagramming and vector drawing software extended with the Chemistry solution from the Science and Education area of ConceptDraw Solution Park.
Venn Diagram Examples for Problem Solving. Computer Science. Chomsky Hierarchy
A Venn diagram, sometimes referred to as a set diagram, is a diagramming style used to show all the possible logical relations between a finite amount of sets. In mathematical terms, a set is a collection of distinct objects gathered together into a group, which can then itself be termed as a single object. Venn diagrams represent these objects on a page as circles or ellipses, and their placement in relation to each other describes the relationships between them. The Venn diagram example below visualizes the the class of language inclusions described by the Chomsky hierarchy.Educational Technology Tools
What are the favorite educational technology tools and techniques for teachers? Of course these are pictures, images and education infographics! ConceptDraw PRO software supplied with Education Infographics Solution from the Business Infographics Area provides powerful drawing tools to help design the education infographics of any complexity.Process Flow Diagram Symbols
Chemical and Process Engineering Solution from the Industrial Engineering Area of ConceptDraw Solution Park is a unique tool which contains variety of predesigned process flow diagram symbols for easy creating various Chemical and Process Flow Diagrams in ConceptDraw PRO.
 Chemical and Process Engineering
This chemical engineering solution extends ConceptDraw PRO v.9.5 (or later) with process flow diagram symbols, samples, process diagrams templates and libraries of design elements for creating process and instrumentation diagrams, block flow diagrams (BFD
- Basic Flowchart Symbols and Meaning | Chemistry Drawings ...
- Filter Paper Draw Chemistry
- Chem Chart Paper Easy Draw
- Filter Paper Chemistry Clipart
- How to Draw Chemistry Structures | Chemistry | Chemistry Drawing ...
- How to Draw Chemistry Structures | Chemistry Drawings | Chemistry ...
- Process Flowchart | Bio Flowchart Lite | Chemistry | Chart Paper In ...
- Gravity filtration of liquids | Chemistry Symbols and Meanings ...
- Chemistry Drawing Software | Laboratory equipment - Vector ...
- Chemistry | Chemistry Symbols and Meanings | Elements Paper ...
- Chemistry Drawing Software | Chemistry Drawings | How to Draw ...
- Laboratory equipment - Vector stencils library | Chemistry Symbols ...
- Laboratory equipment - Vector stencils library | Chemistry Drawing ...
- Gravity filtration of liquids | Draw And Label The Separation ...
- Chemistry Drawing Software | Chemistry Drawings | Organic ...
- Chemistry Drawings | Design elements - Laboratory equipment ...
- Hot Plate Chemistry Drawing
- Gravity filtration of liquids | Laboratory equipment - Vector stencils ...
- How to Draw Chemistry Structures | Chemistry Drawing Software ...
- Drawings Of Chemistry Lab Equipment


.png)




--laboratory-equipment---vector-stencils-library.png--diagram-flowchart-example.png)
-laboratory-equipment---vector-stencils-library.png--diagram-flowchart-example.png)
-laboratory-equipment---vector-stencils-library.png--diagram-flowchart-example.png)
