Control and Information Architecture Diagrams (CIAD) with ConceptDraw DIAGRAM
One of the three main constituents of any enterprise is the Control and Information Architecture. The rest two are Production facilities and People and Organization.Graphics Software for Business
If you want to use effective methods for your business, you may need a tool which may let you represent your ideas and goals in graphic way. Software with different flowchart templates for each type of business will be your lifesaver. ConceptDraw DIAGRAM with its business samples, libraries and design elements is a point to start.Information Architecture
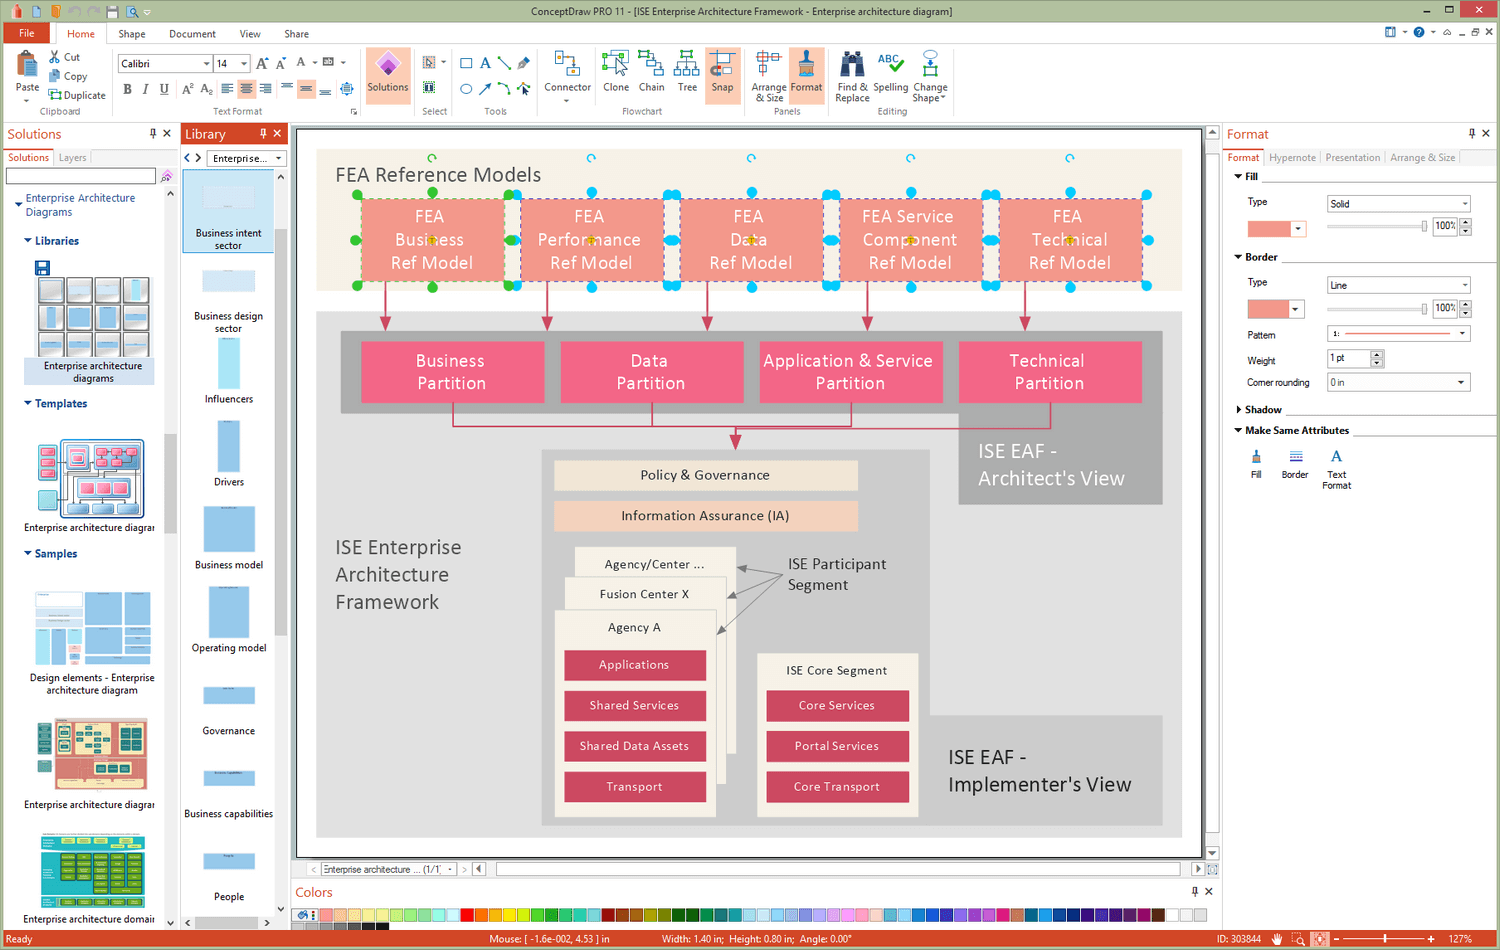
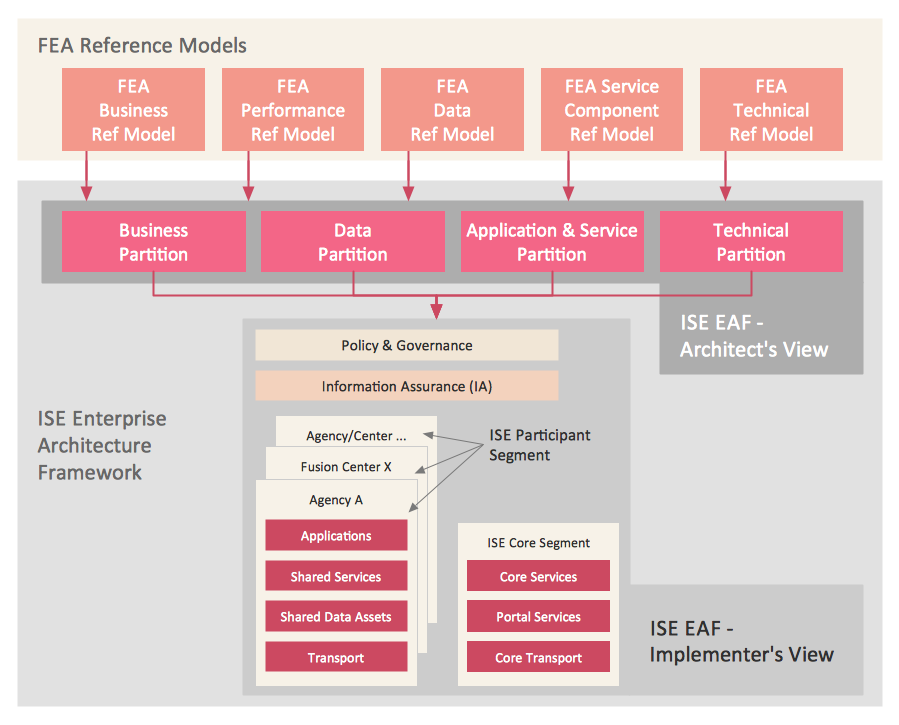
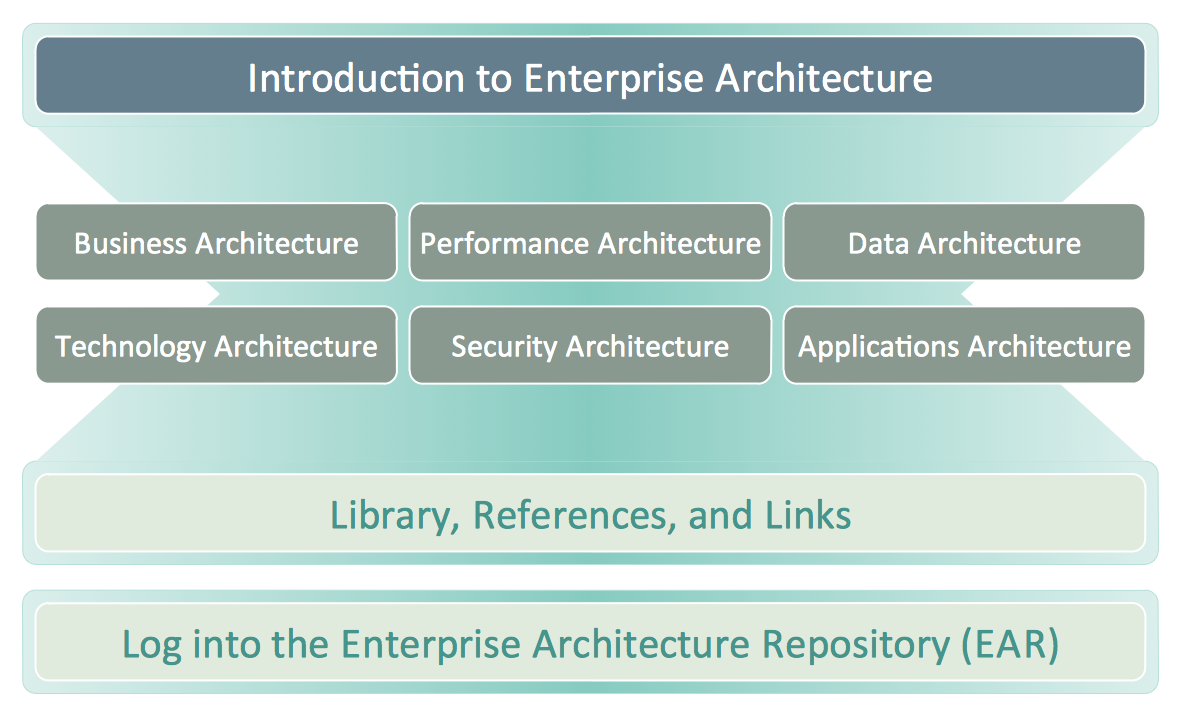
You want design the Information Architecture and need a powerful software for this? ConceptDraw DIAGRAM extended with Enterprise Architecture Diagrams Solution from the Management Area is exactly what you need.What Is Information Architecture
What is information architecture? Information architecture (IA) is a broad and abstract term. At the most general sense the information architecture describes the structure of a system, how the different pieces of information are related at the system and represents their relationships. The information architecture term was introduced by Richard Saul Wurman in 1975 and now is commonly used in the context of websites and intranets, information structures and computer systems. ConceptDraw DIAGRAM extended with Enterprise Architecture Diagrams Solution from the Management Area is the best software for design information architecture and drawing Enterprise Architecture Diagrams.Timeline Examples
ConceptDraw DIAGRAM diagramming and vector drawing software offers the Timeline Diagrams solution from the Management area which is rich for the timeline examples, samples, templates and ready-to-use vector shapes.Database Design
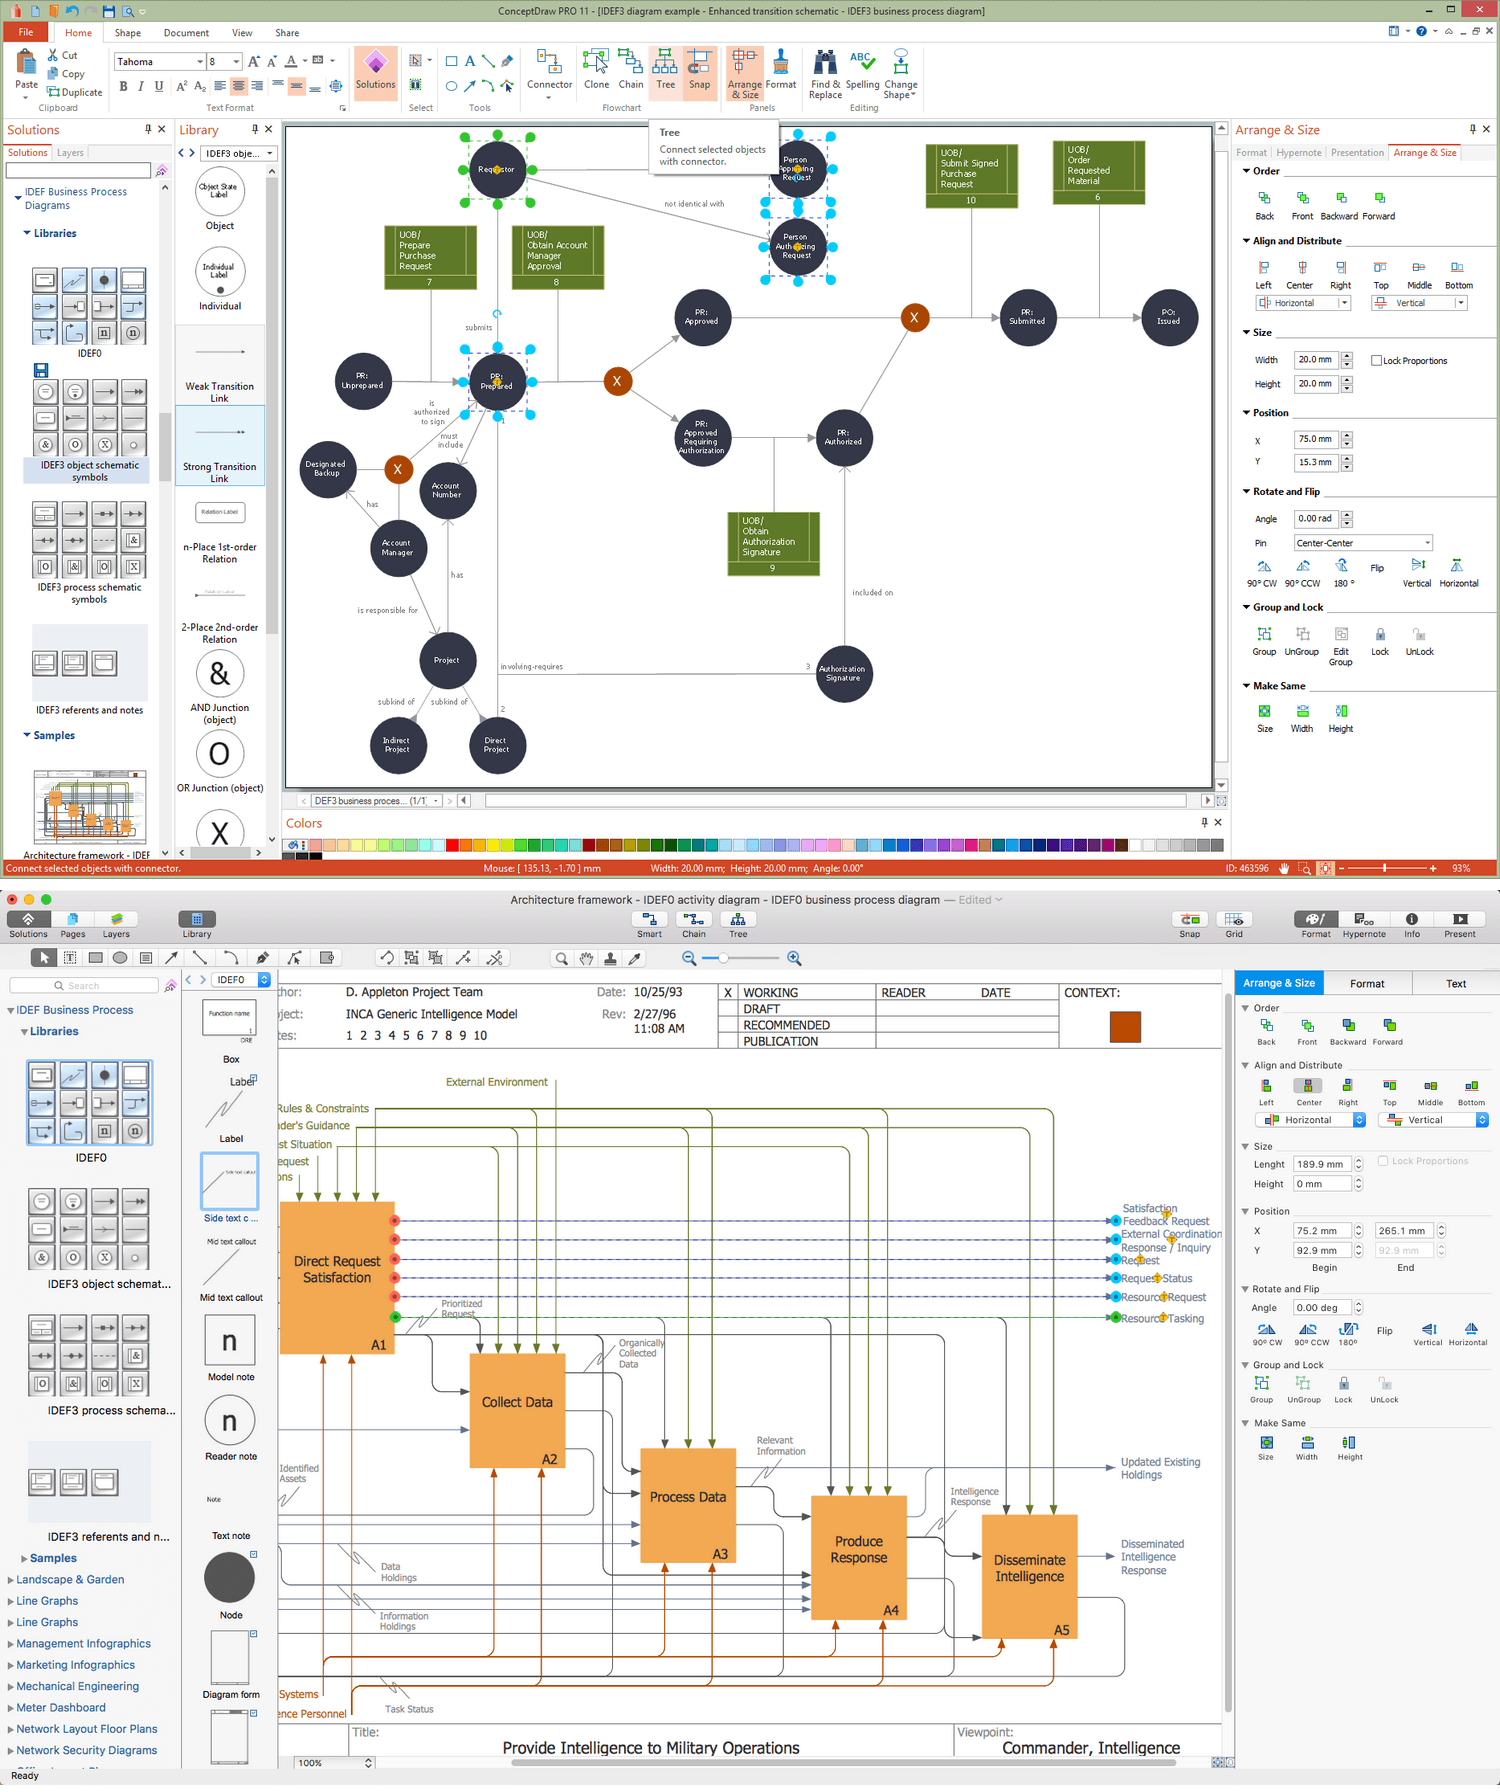
ConceptDraw DIAGRAM extended with IDEF Business Process Diagrams solution from the Business Processes area of ConceptDraw Solution Park is an ideal software for effective database design and drawing IDEF diagrams visually representing all steps of database design process.Business Architecture
ConceptDraw DIAGRAM is a powerful diagramming and vector drawing software. Supplied with Enterprise Architecture Diagrams Solution from the Management Area, ConceptDraw DIAGRAM is ideal for construction the Business Architecture Diagrams.Venn Diagram
Venn diagrams are illustrations used in the branch of mathematics known as set theory. They show the mathematical or logical relationship between different groups of things (sets). A Venn diagram shows all the possible logical relations between the sets.Sample Project Flowchart. Flowchart Examples
This sample shows the Flowchart that displays the architecture of SQL Exception Translation. This sample was created in ConceptDraw DIAGRAM diagramming and vector drawing software using the Flowcharts solution from the Diagrams area of ConceptDraw Solution Park.
Data Flow Diagram (DFD)
A Data Flow Diagram (DFD) illustrates the flow of data through an information system, visualizes how the information is handled in terms of inputs and outputs, how the data enter to system and leave it. It is effective to use a Data Flow Diagram for creation the system's overview, to show the system's scope and boundaries. There are two different types of notations for DFDs: Yourdon-Coad and Gane-Sarson, which differ in visual representations for processes, data flow, data stores, external entities, etc. Thus, for example the processes are depicted as circles in Yourdon-Coad notation and as rounded squares in Gane-Sarson notation. Gane-Sarson notation is usually used for visualization information systems and Yourdon-Coad - for system analysis and design. The Data Flow Diagrams solution included to Software Development area of ConceptDraw Solution Park offers a lot of DFD templates, samples and examples, libraries of vector stencils for construction without efforts the DFDs according to both Gane-Sarson and Yourdon-Coad notations.Data structure diagram with ConceptDraw DIAGRAM
Data structure diagram (DSD) is intended for description of conceptual models of data (concepts and connections between them) in the graphic format for more obviousness. Data structure diagram includes entities description, connections between them and obligatory conditions and requirements which connect them. Create Data structure diagram with ConceptDraw DIAGRAM.UML Diagrams with ConceptDraw DIAGRAM
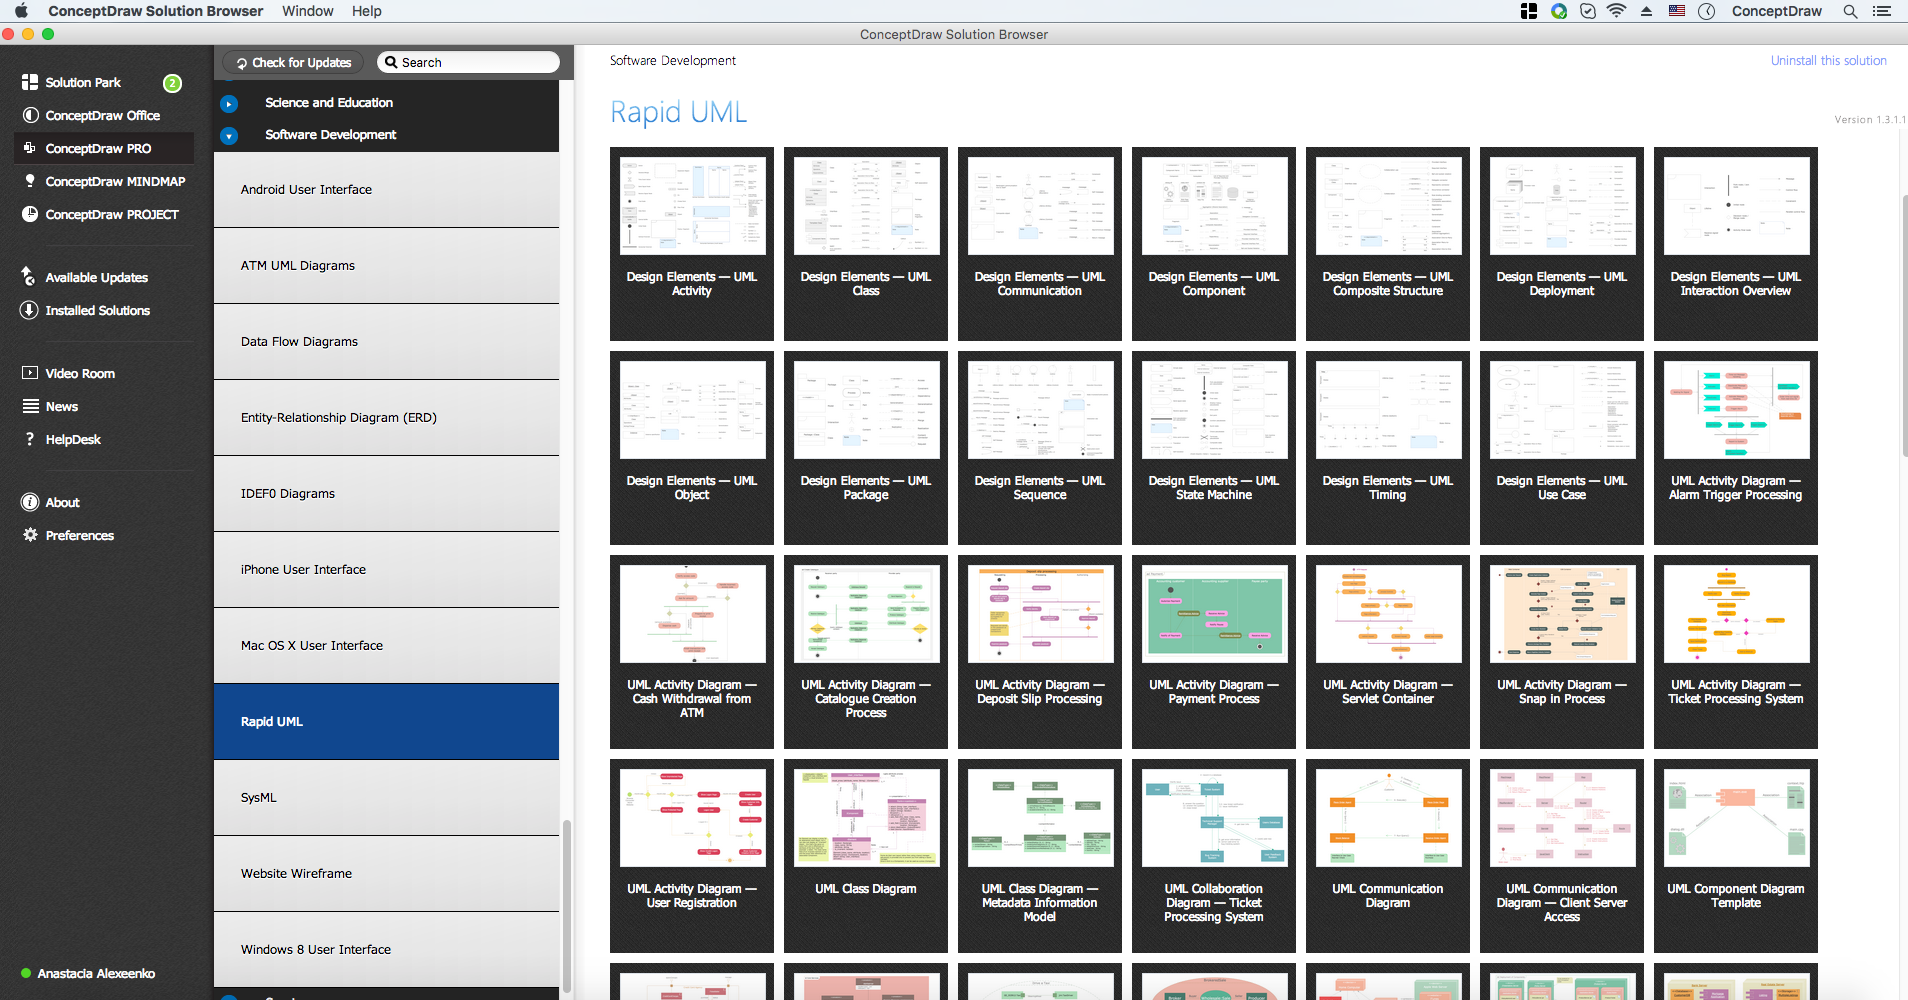
Unified Modeling Language (UML) is a single modeling language that is used in software engineering to represent effectively the structure of complex computer systems and software. Such visual models in form of UML diagrams allow simplify the process of software development, let to meet the deadlines, improve the final software products, and also facilitate communication process between the customer, system analysts and programmers. The UML language defines standards for operations, methods of programming languages, and their terminology. The main types of UML diagrams are: Activity diagram, Use Case diagram, Deployment diagram, Statechart diagram, Class diagram, Component diagram, Sequence diagram, Collaboration diagram. ConceptDraw DIAGRAM extended with Rapid UML solution is a professional software that provides perfect possibility of easy designing detailed UML diagrams. It offers large number of task-oriented templates and predesigned vector stencils that correspond to standard UML diagram notation. Use them to instantly design the UML diagrams.Data modeling with ConceptDraw DIAGRAM
Data modelling will help you to study and analyze business processes in your organization for optimization and increase of effectiveness and production.GUI Prototyping with ConceptDraw DIAGRAM
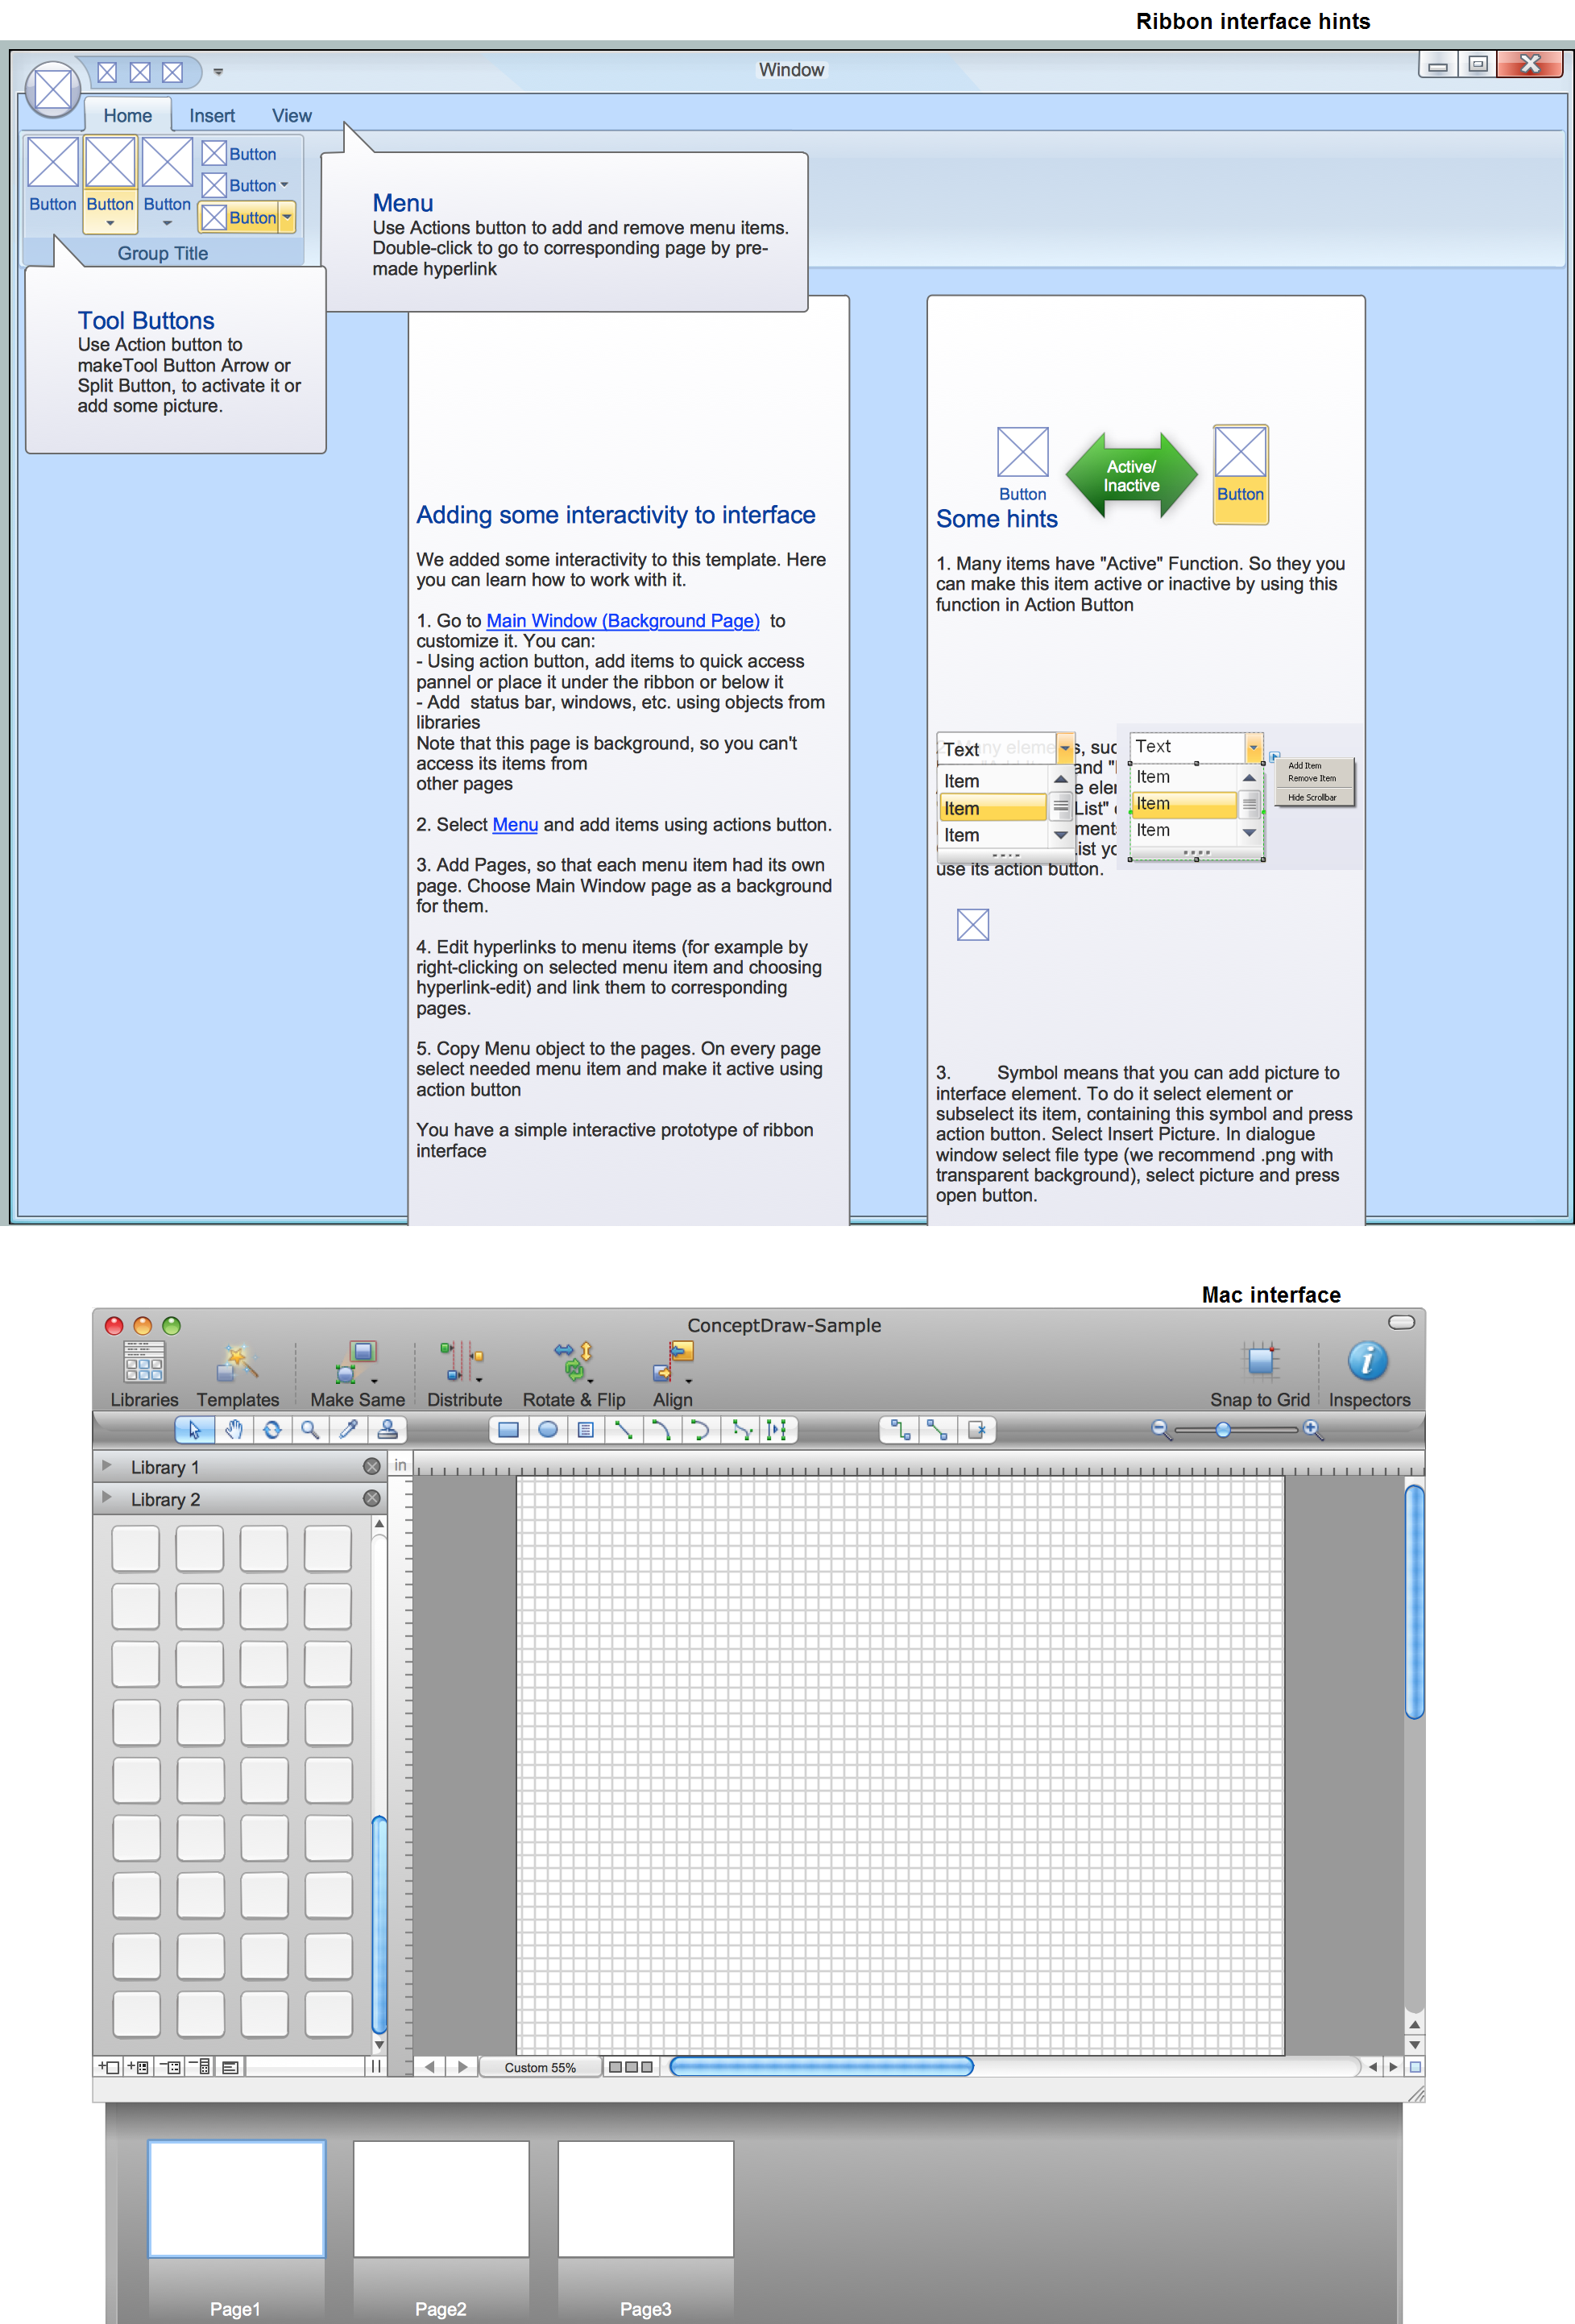
All about prototyping. GUI Prototyping with ConceptDraw. Download prototyping software.Software development with ConceptDraw DIAGRAM
Modern software development requires creation of large amount of graphic documentation, these are the diagrams describing the work of applications in various notations and cuts, also GUI design and documentation on project management. ConceptDraw DIAGRAM technical and business graphics application possesses powerful tools for software development and designing technical documentation for object-oriented projects. Solutions included to the Software Development area of ConceptDraw Solution Park provide the specialists with possibility easily and quickly create graphic documentation. They deliver effective help in drawing thanks to the included package of templates, samples, examples, and libraries with numerous ready-to-use vector objects that allow easily design class hierarchies, object hierarchies, visual object-oriented designs, flowcharts, GUI designs, database designs, visualize the data with use of the most popular notations, including the UML and Booch notations, easy manage the development projects, automate projection and development.- Data Flow Diagram (DFD) | Control and Information Architecture ...
- Information Architecture | Control and Information Architecture ...
- Enterprise Architecture Diagrams | Control and Information ...
- Architecture Diagrams | AWS Architecture Diagrams | Control and ...
- Information Architecture | What Is Information Architecture | Control ...
- Software Development | Network Architecture | Control and ...
- Blank Scatter Plot | Control and Information Architecture Diagrams ...
- Process Flowchart | Types of Flowchart - Overview | Control and ...
- Business Architecture | Control and Information Architecture ...
- Pyramid Diagram | Control and Information Architecture Diagrams ...
- Cross-Functional Flowchart | Control and Information Architecture ...
- Enterprise Architecture Diagrams | Information Architecture | Control ...
- Process Flowchart | Control and Information Architecture Diagrams ...
- Organizational Structure | Matrix Organization Structure | Control ...
- Architecture Diagrams | Enterprise Architecture Diagrams | Control ...
- Organizational Structure | Control and Information Architecture ...
- Diagram Creator | Control and Information Architecture Diagrams ...
- Database Design | Computer Network Architecture. Computer and ...
- In System Archirtecture What Is Data Flow

