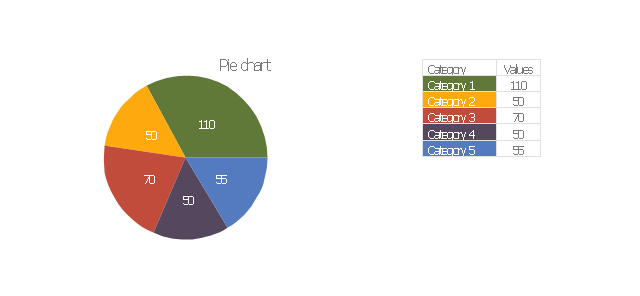
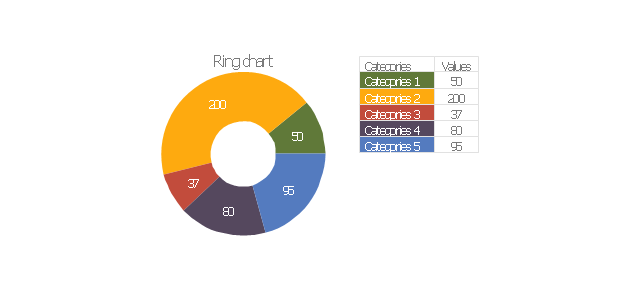
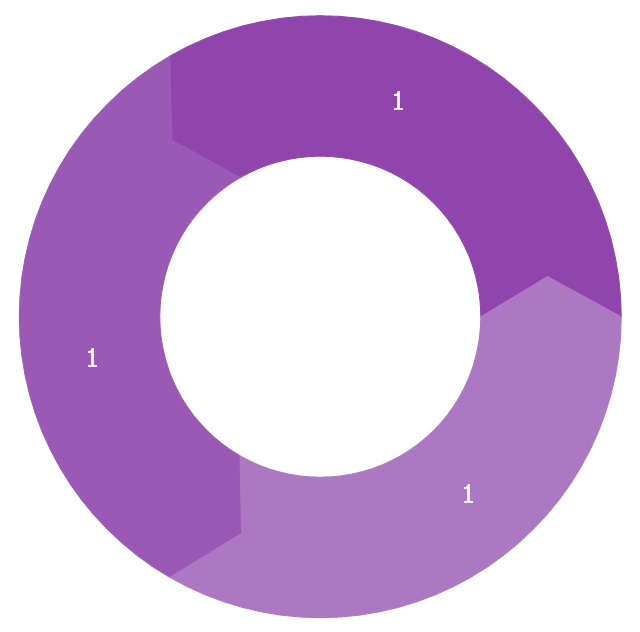
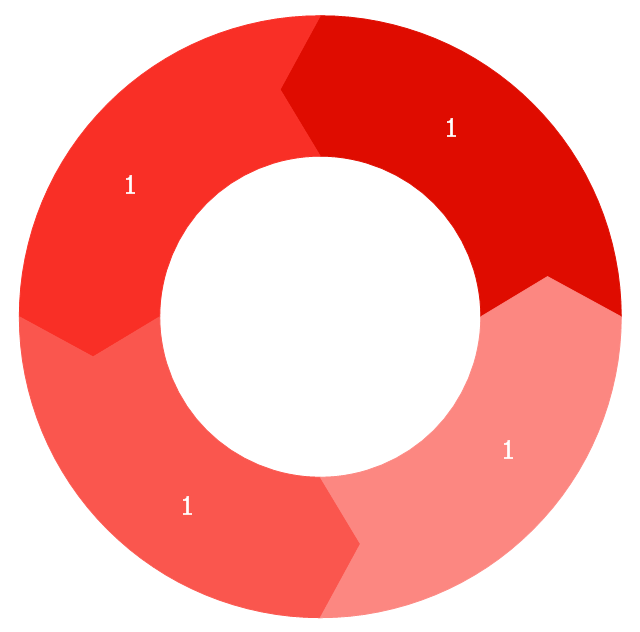
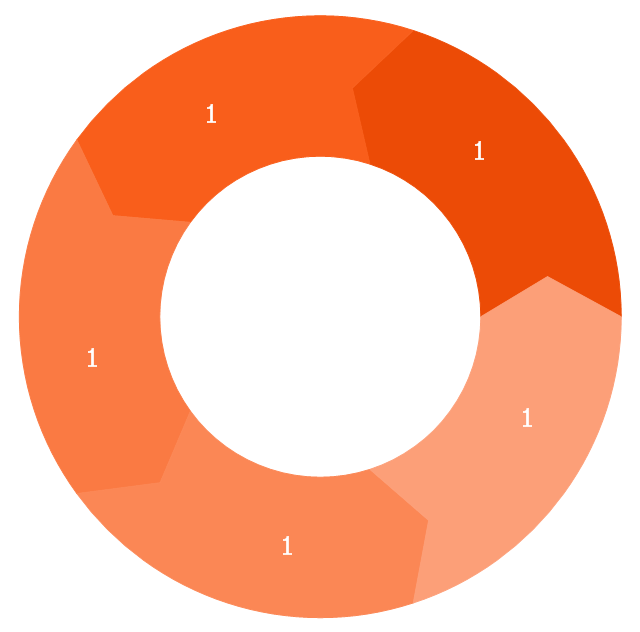
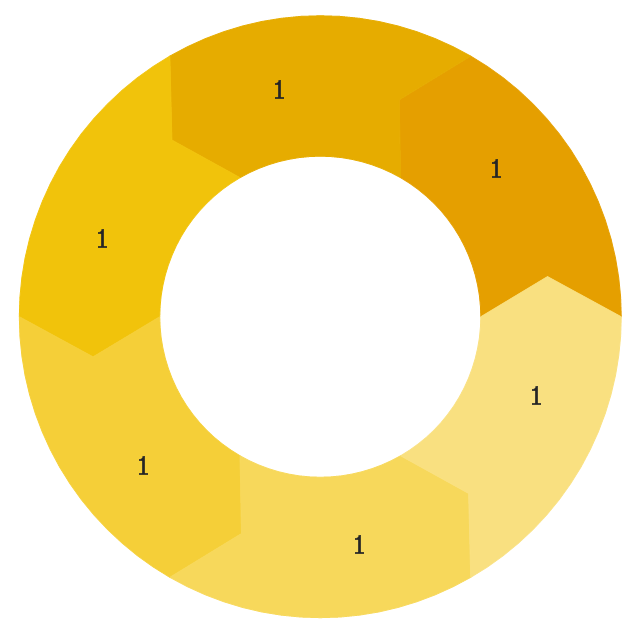
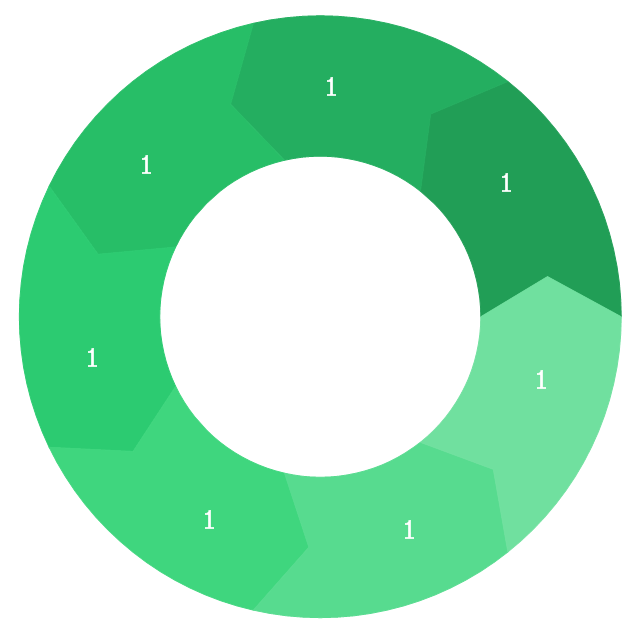
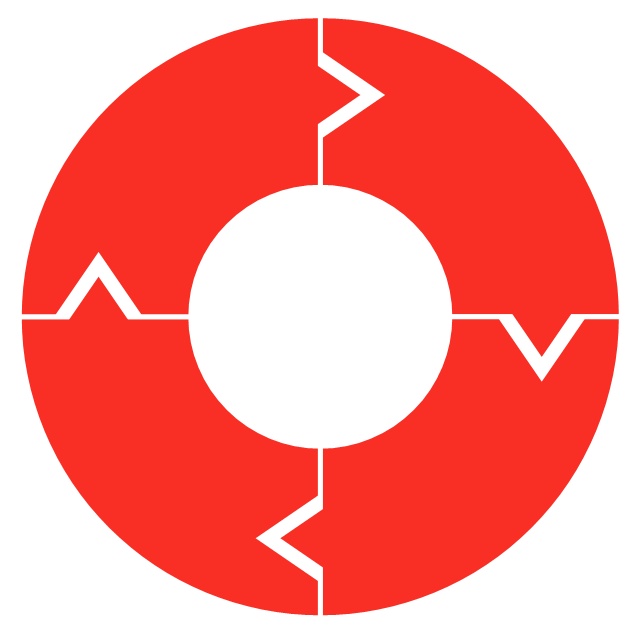
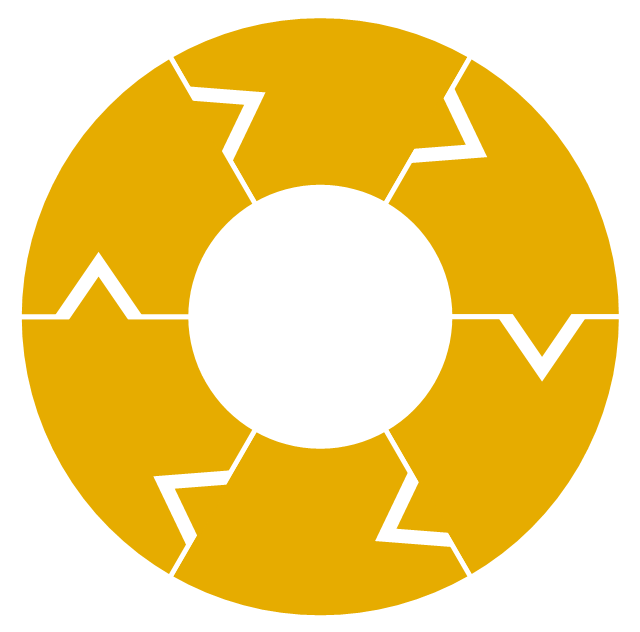
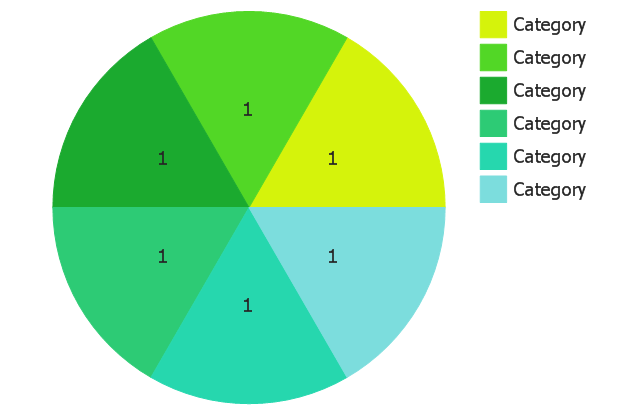
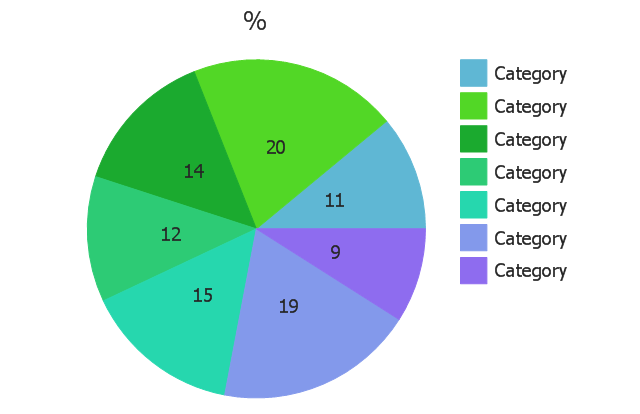
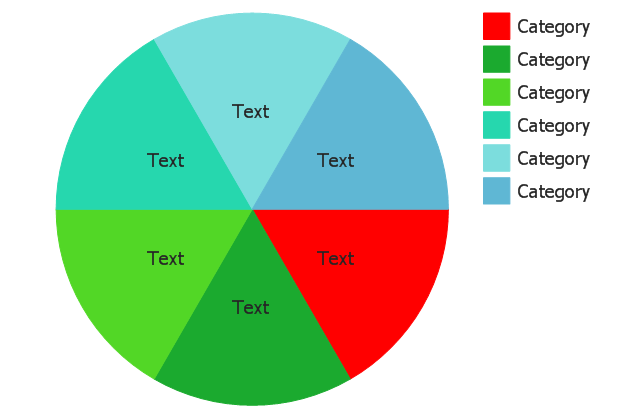
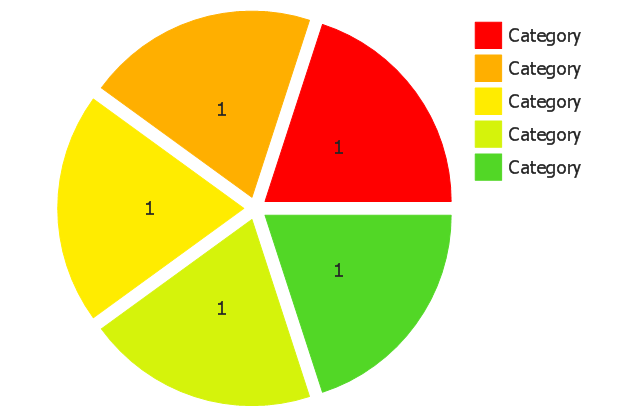
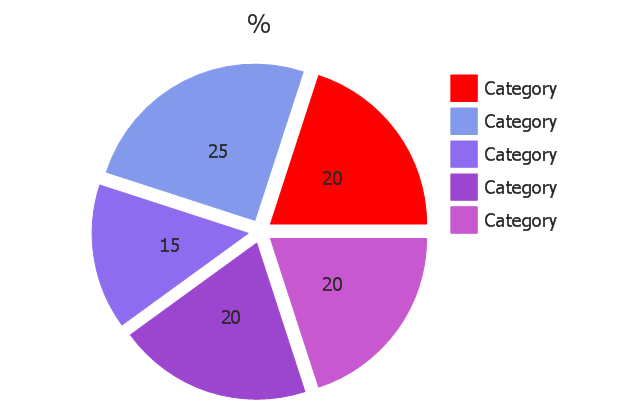
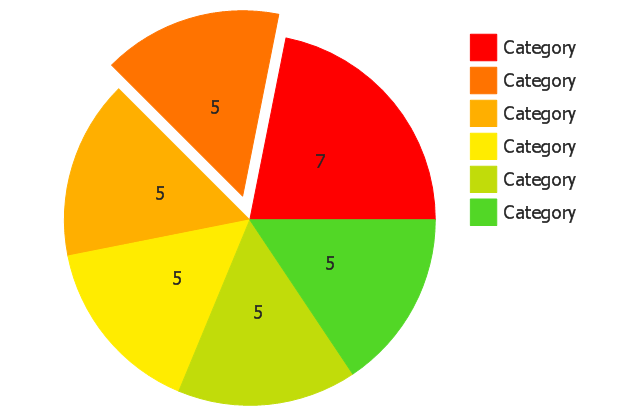
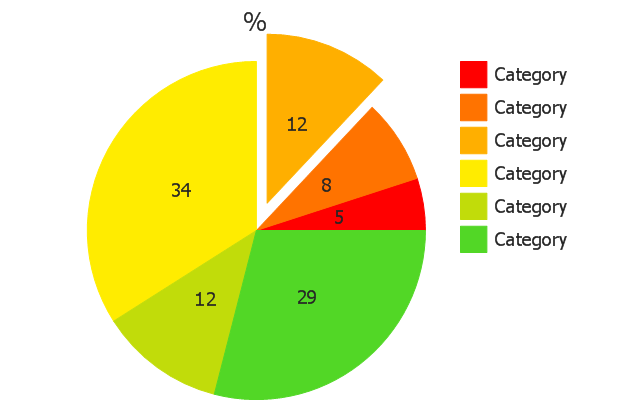
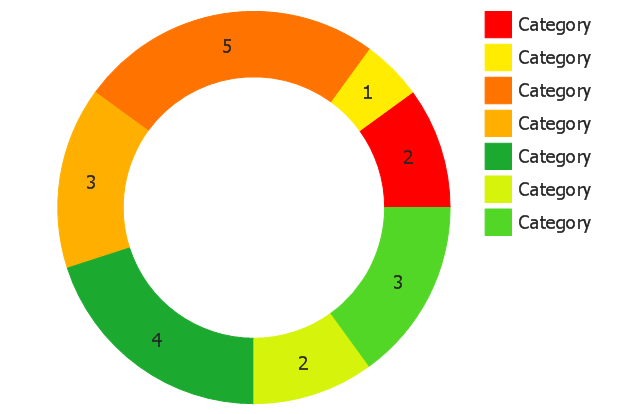
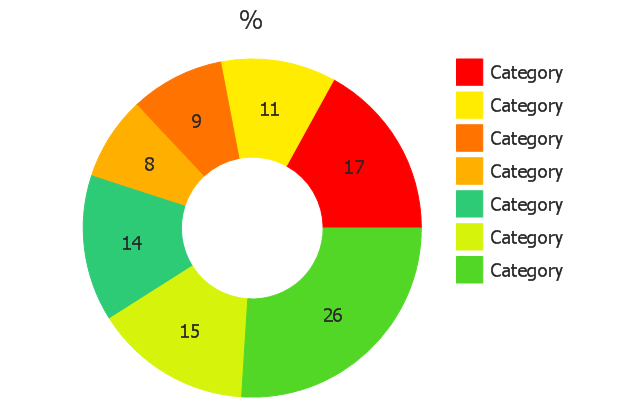
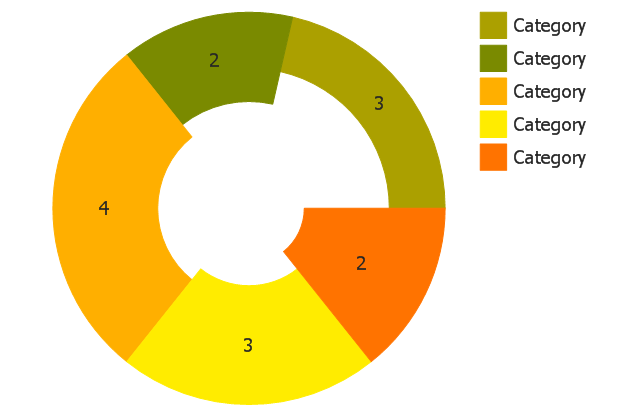
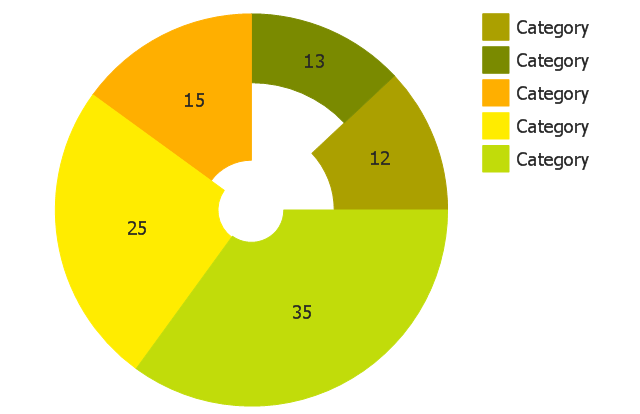
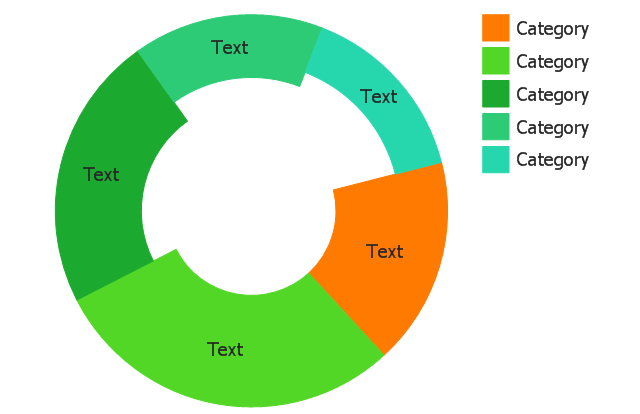
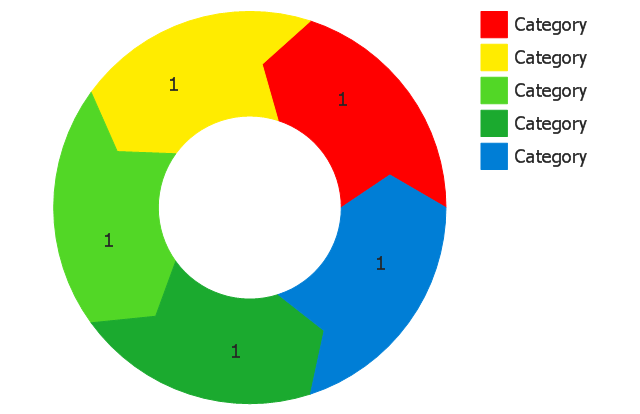
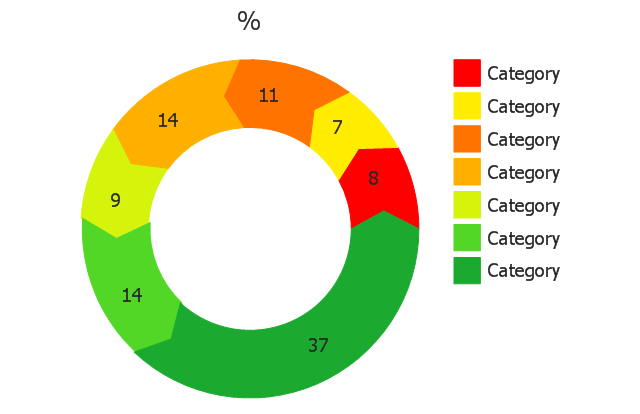
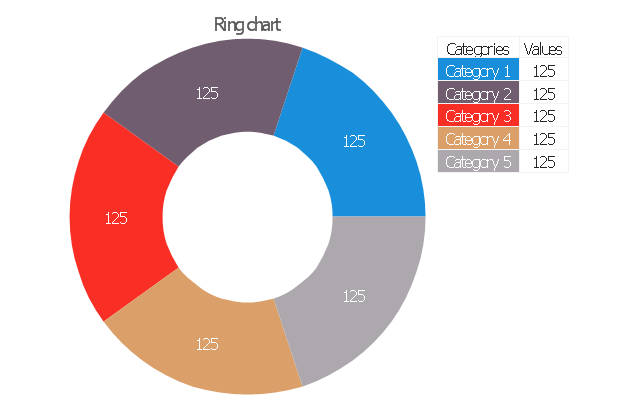
The vector stencils library "Pie charts" contains 30 templates of pie and donut (doughnut, ring) charts for visualizing percentage for parts of one total, or compare parts of few totals.
Drag a template from the library into your document and enter your data.
Use these shapes to draw your pie charts and donut charts in the ConceptDraw PRO diagramming and vector drawing software.
The vector stencils library "Pie charts" is included in the Pie Charts solution of the Graphs and Charts area in ConceptDraw Solution Park.
 Pie Charts
Pie Charts are extensively used in statistics and business for explaining data and work results, in mass media for comparison (i.e. to visualize the percentage for the parts of one total), and in many other fields. The Pie Charts solution for ConceptDraw DIAGRAM offers powerful drawing tools, varied templates, samples, and a library of vector stencils for simple construction and design of Pie Charts, Donut Chart, and Pie Graph Worksheets.
Percentage Pie Chart. Pie Chart Examples
This sample was created in ConceptDraw DIAGRAM diagramming and vector drawing software using the Pie Charts Solution from Graphs and Charts area of ConceptDraw Solution Park. This sample shows the Pie Chart of the approximate air composition. You can see the percentage of oxygen, nitrogen and other gases in the air visualized on this Pie Chart.Pie Chart Examples and Templates
A pie chart or a circle graph is a circular chart divided into sectors, illustrating numerical proportion. In a pie chart, the arc length of each sector and consequently its central angle and area, is proportional to the quantity it represents. Pie chart examples and templates created using ConceptDraw DIAGRAM software helps you get closer with pie charts and find pie chart examples suite your needs.The vector stencils library "Circular diagrams" contains 42 templates of circular diagrams: circular arrow diagram, circular motion diagram, arrow ring chart, doughnut chart (donut chart), circle pie chart, diamond pie chart, circle diagram, pie chart, ring chart, loop diagram, block loop diagram, arrow loop circle, crystal diagram, triangular diagram, diamond diagram, pentagon diagram, hexagon diagram, heptagon diagram, cycle diagram (cycle chart), stacked Venn diagram (onion diagram), arrow circle diagram.
Use these shapes to illustrate your marketing and sales documents, presentations, webpages and infographics in the ConceptDraw PRO diagramming and vector drawing software extended with the Target and Circular Diagrams solution from the Marketing area of ConceptDraw Solution Park.
www.conceptdraw.com/ solution-park/ marketing-target-and-circular-diagrams
Flowchart design. Flowchart symbols, shapes, stencils and icons
A flowchart is a type of diagram which represents an algorithm, process or workflow, displays the steps as boxes of various kinds and depicts their order by connecting them with arrows. Any business graphic document will be more colorful and understandable if will use professional-looking and visual diagrams and flowcharts. Flowchart design gives versatile presenting and explaining of the process. ConceptDraw DIAGRAM flowchart software enhanced with Flowcharts solution helps effectively make Flowchart Design. Use of predesigned flowchart symbols and bright color palette offers a fresh view and favorably distinguishes the flowcharts designed in ConceptDraw DIAGRAM from the black and white flowcharts on a paper. Preferably to use no more than three or four colors and apply identical for the same shape types. The best flowchart design can be achieved by starting with Flowchart template, or any of suitable ready examples or samples offered in ConceptDraw STORE, open one of them and enter the proper text into each Flowchart shape. Each symbol of the flowchart has a definition that can't be changed. This means that all flowcharts shapes can be grouped in according to their meaning. Users with ConceptDraw DIAGRAM flowchart software can style groups of symbols with close definitions by color sets chosen from complementary palette. Almost all workflows can be depicted as a flowchart. Colored diagrams are more light for perception of the certain information, this is part of flowchart design. Bright colors need to be used in the key points of Decision symbols, to focus attention on their importance for whole process flow.
Pie Donut Chart. Pie Chart Examples
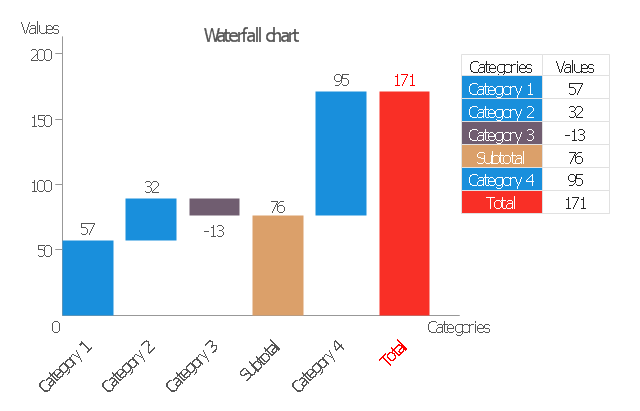
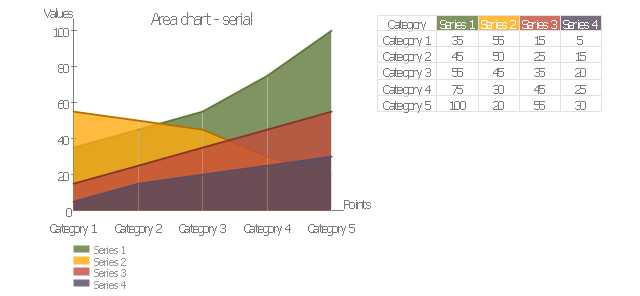
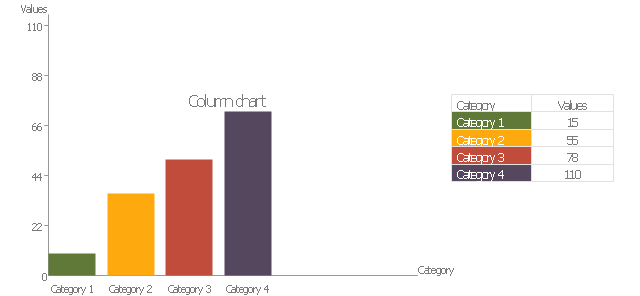
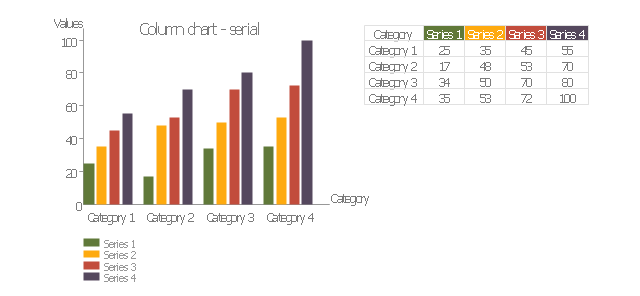
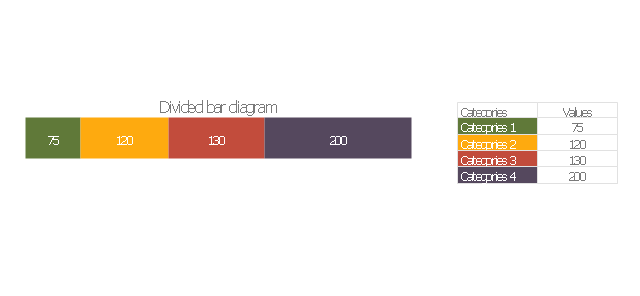
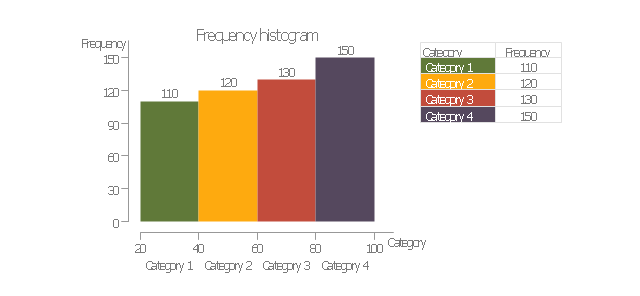
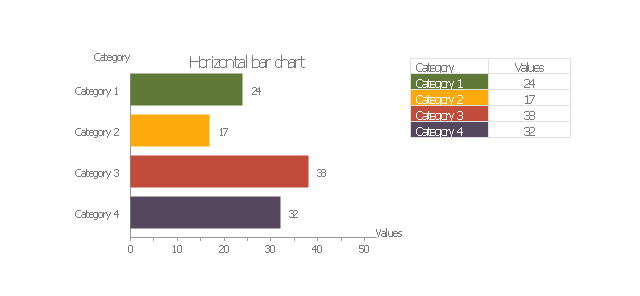
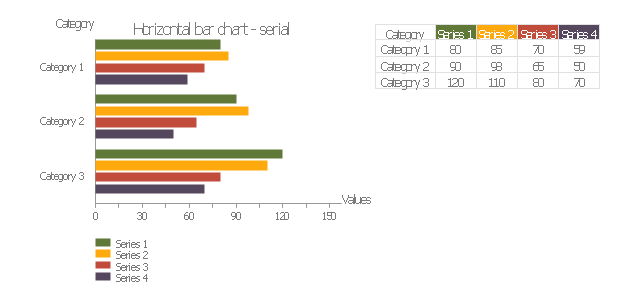
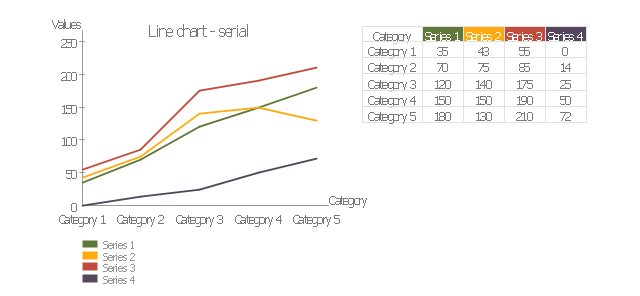
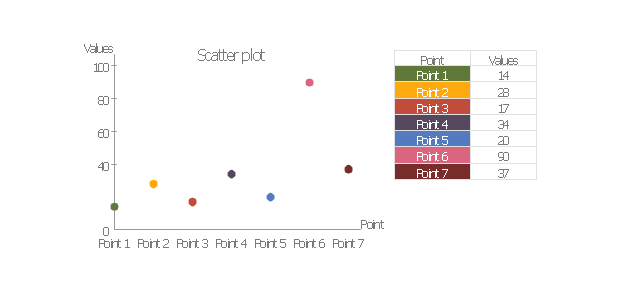
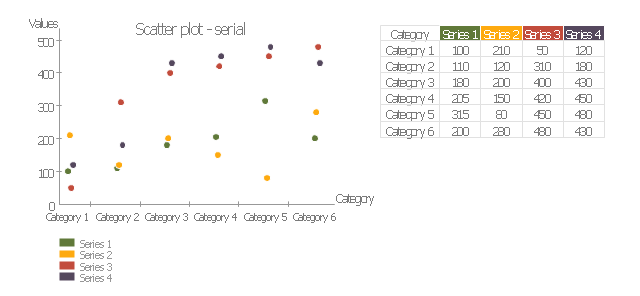
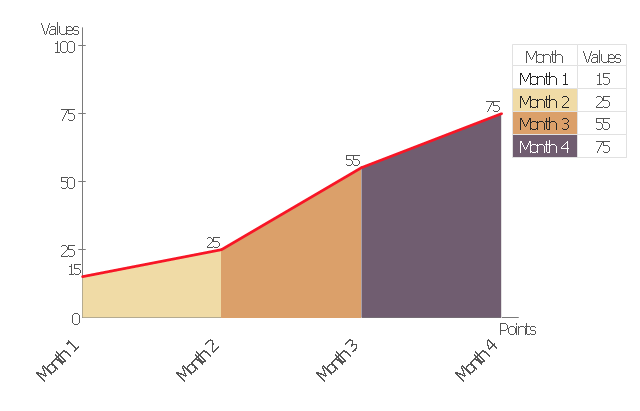
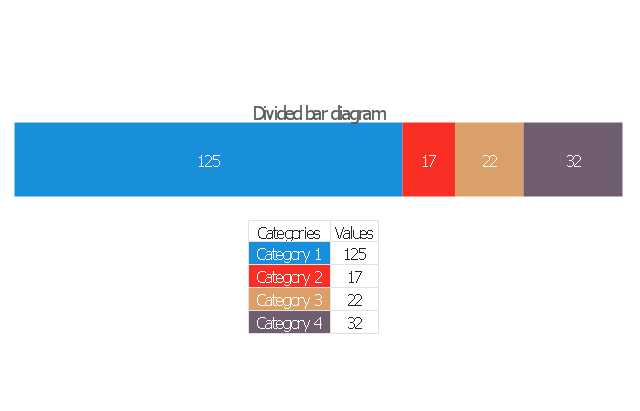
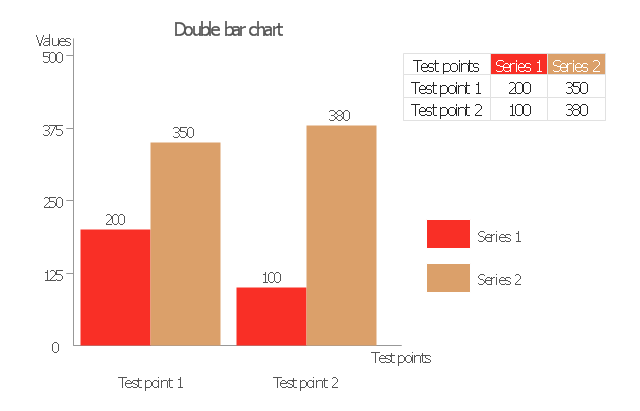
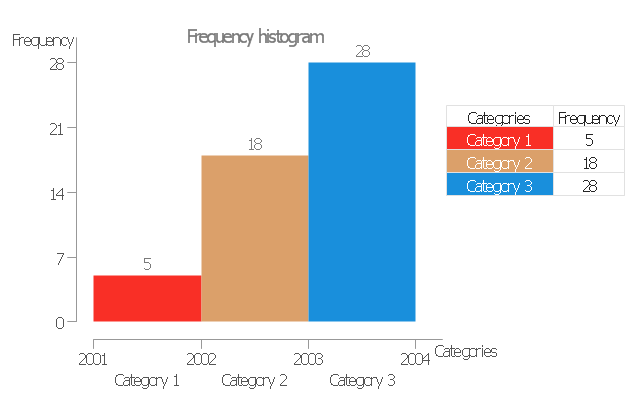
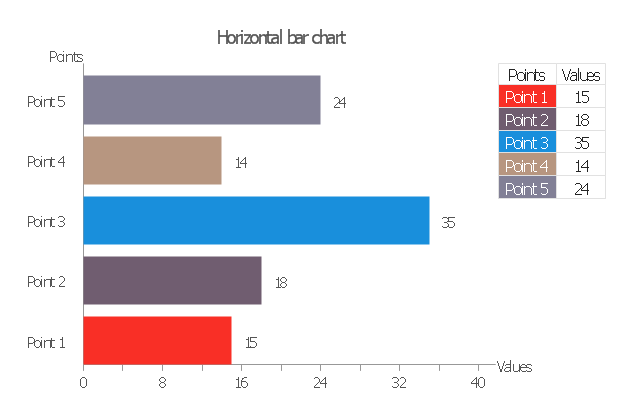
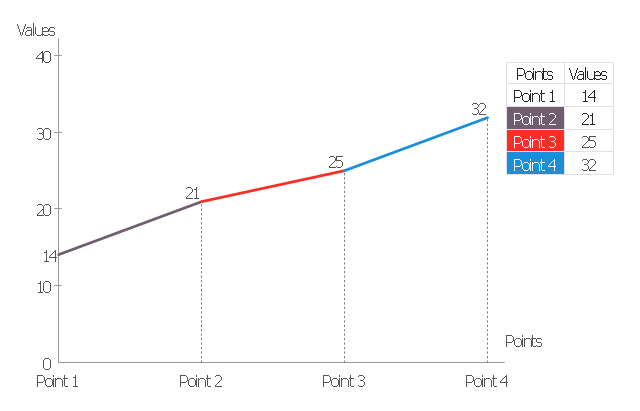
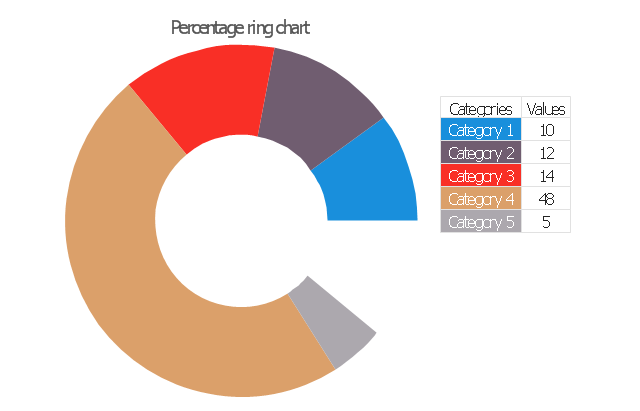
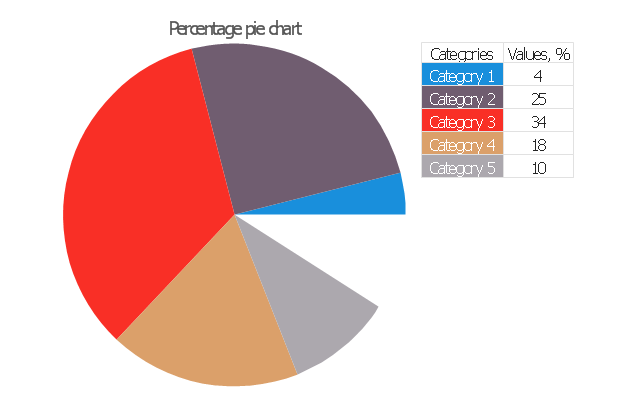
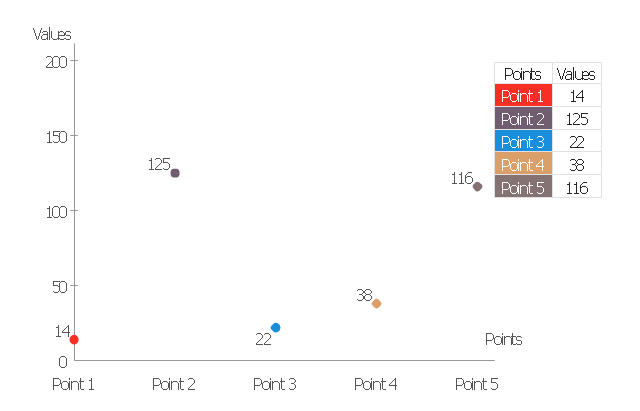
This sample shows the Pie Donut Chart. It was created in ConceptDraw DIAGRAM diagramming and vector drawing software using the ready-to-use object from the Pie Charts Solution from Graphs and Charts area of ConceptDraw Solution Park. The Pie Donut Chart visualizes the percentage of parts of the whole and looks like as a ring divided into sectors. Pie Donut Charts are widely used in the business, statistics, analytics, mass media.The vector stencils library "Data-driven charts" contains 13 data-driven graphs and charts: area chart, divided bar diagram, double bar graph, frequency histogram, horizontal bar chart, line graph, percentage ring chart, percentage pie chart, scatter plot, column chart, waterfall chart.
Use it to visualize quantitative data in your data-driven infographics.
The graphs example "Data-driven charts - Vector stencils library" was created using the ConceptDraw PRO diagramming and vector graphics software extended with the Data-driven Infographics solution from the area "What is infographics" of ConceptDraw Solution Park.
The vector stencils library "Education charts" contains 12 graphs and charts: area chart, column chart, divided bar diagram, histogram, horizontal bar graph, line graph, pie chart, ring chart, scatter plot.
Use it to create your education infogram in the ConceptDraw PRO diagramming and vector drawing software.
The vector stencils library "Education charts" is included in the Education Infographics solution from the Business Infographics area of ConceptDraw Solution Park.
Use it to create your education infogram in the ConceptDraw PRO diagramming and vector drawing software.
The vector stencils library "Education charts" is included in the Education Infographics solution from the Business Infographics area of ConceptDraw Solution Park.
Bar Chart Examples
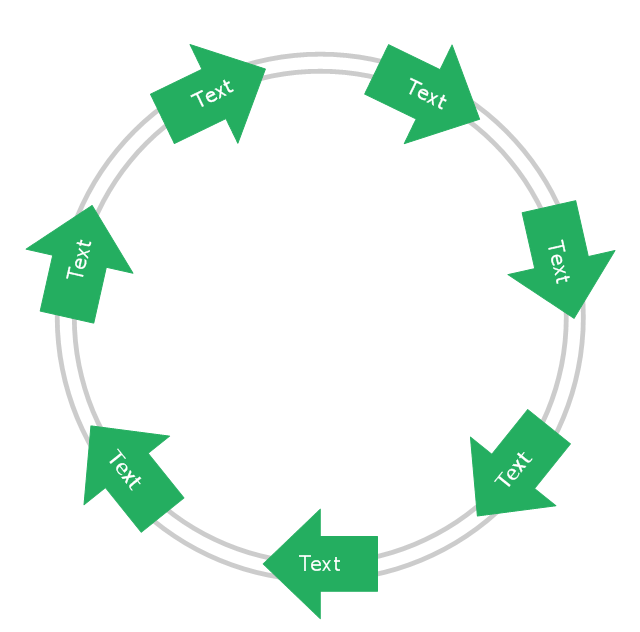
Complete set of bar chart examples is produced using ConceptDraw software. Surfing bar chart examples you can find an example that is the best for your case.The vector stencils library "Circular arrows diagrams" contains 20 templates of circular arrows diagrams and arrow donut charts.
Use these shapes to draw your circular arrows diagrams in the ConceptDraw PRO diagramming and vector drawing software.
The vector stencils library "Circular arrows diagrams" is included in the Circular Arrows Diagrams solution from the area "What is a Diagram" of ConceptDraw Solution Park.
Use these shapes to draw your circular arrows diagrams in the ConceptDraw PRO diagramming and vector drawing software.
The vector stencils library "Circular arrows diagrams" is included in the Circular Arrows Diagrams solution from the area "What is a Diagram" of ConceptDraw Solution Park.
Pie Chart Word Template. Pie Chart Examples
The Pie Chart visualizes the data as the proportional parts of a whole and looks like a disk divided into sectors. The pie chart is type of graph, pie chart looks as circle devided into sectors. Pie Charts are widely used in the business, statistics, analytics, mass media. It’s very effective way of displaying relative sizes of parts, the proportion of the whole thing.Pie Chart Software
A pie chart is a circular diagram showing a set of data divided into proportional slices. There are several variations of this chart such as donut chart, exploded pie chart, multi-level pie charts. Although it is not very informative when a ring chart or circle chart has many sections, so choosing a low number of data points is quite important for a useful pie chart. ConceptDraw DIAGRAM software with Pie Charts solution helps to create pie and donut charts for effective displaying proportions in statistics, business and mass media for composition comparison, i.e. for visualization of part percentage inside one total.Donut Chart
ConceptDraw DIAGRAM diagramming and vector drawing software offers the Pie Charts solution from the Graphs and Charts area which includes the tools for quick and easy designing any kind of Donut Chart.
 Basic Pie Charts
This solution extends the capabilities of ConceptDraw DIAGRAM (or later) with templates, samples, and a library of vector stencils for drawing pie and donut charts.
- Graph Pai Chart Vector Png
- Pie Charts | Pie Chart Examples and Templates | Circular diagrams ...
- Pie charts - Vector stencils library | Data-driven charts - Vector ...
- Circular diagrams - Vector stencils library | Pie Charts | Pie Chart | 2 ...
- Chart Templates | Chart Examples | Pie Charts | Percentage Chart Png
- Pie Charts | Circular diagrams - Vector stencils library | Pie Chart ...
- Pie Charts | Donut Chart | Chart Templates | Donut Chart Png
- Png Circle Chart Blank
- Data-driven charts - Vector stencils library | Pie Chart Software ...
- National Preparedness Cycle - Arrow ring chart | Circular diagrams ...
- Percentages of the U.S. population by race | Pie Charts | Chart ...
- Pie charts - Vector stencils library | Pie Chart Word Template. Pie ...
- Android User Interface | Restaurant plan | Pie Chart Software ...
- Pie charts - Vector stencils library | Percentage Pie Chart . Pie Chart ...
- Circle -spoke diagram - Vector stencils library | Circular diagrams ...
- Management indicators - Vector stencils library | Blue Gage Indicator ...
- Circular diagrams - Vector stencils library | Pie charts - Vector ...
- Circular diagrams - Vector stencils library | Diamond Crystal Line ...
- Graph Donut Png
- Pie Chart Examples and Templates | Exploded pie chart ...
-pie-charts---vector-stencils-library.png--diagram-flowchart-example.png)
-pie-charts---vector-stencils-library.png--diagram-flowchart-example.png)
-pie-charts---vector-stencils-library.png--diagram-flowchart-example.png)
-pie-charts---vector-stencils-library.png--diagram-flowchart-example.png)
,-control-dots-pie-charts---vector-stencils-library.png--diagram-flowchart-example.png)
-pie-charts---vector-stencils-library.png--diagram-flowchart-example.png)
-pie-charts---vector-stencils-library.png--diagram-flowchart-example.png)
-pie-charts---vector-stencils-library.png--diagram-flowchart-example.png)
-pie-charts---vector-stencils-library.png--diagram-flowchart-example.png)
-pie-charts---vector-stencils-library.png--diagram-flowchart-example.png)
-pie-charts---vector-stencils-library.png--diagram-flowchart-example.png)
-2-pie-charts---vector-stencils-library.png--diagram-flowchart-example.png)
-2-pie-charts---vector-stencils-library.png--diagram-flowchart-example.png)
,-control-dots-pie-charts---vector-stencils-library.png--diagram-flowchart-example.png)
-pie-charts---vector-stencils-library.png--diagram-flowchart-example.png)
-pie-charts---vector-stencils-library.png--diagram-flowchart-example.png)



-data-driven-charts---vector-stencils-library.png--diagram-flowchart-example.png)
