Circle Diagrams

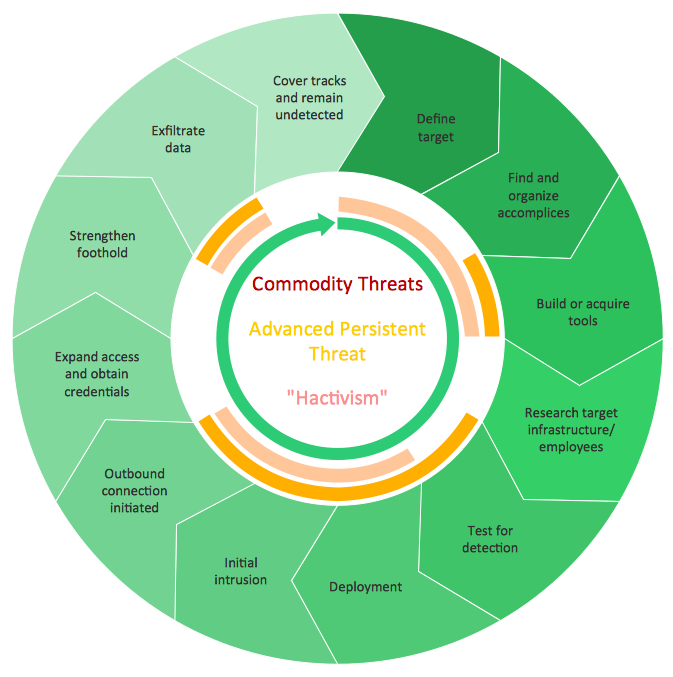
What Is a Circle Spoke Diagram

Circle Spoke Diagram Template

Bar Diagrams for Problem Solving. Create business management bar charts with Bar Graphs Solution

Pie Chart Software

2 Circle Venn Diagram. Venn Diagram Example

3 Circle Venn Diagram. Venn Diagram Example

 ConceptDraw Solution Park
ConceptDraw Solution Park collects graphic extensions, examples and learning materials
Best Diagramming


Venn Diagram Examples for Problem Solving. Venn Diagram as a Truth Table

Entity Relationship Diagram - ERD - Software for Design Crows Foot ER Diagrams
_Win_Mac.png)

3 Circle Venn. Venn Diagram Example

Circles Venn Diagram

Flow Chart Symbols

Circular Arrows
- Circular Flow Diagram Template | Circular Arrows | Circular Arrow ...
- Circle Diagrams | Pie Chart Software | Circle Spoke Diagram ...
- Circle Diagrams Templates
- Circle Diagrams | What Is a Circle Spoke Diagram ...
- Lifecycle of an award - Circle diagram | Circle Diagrams | Research ...
- Pie Chart Software | Classroom Seating Chart Maker | Flow Chart ...
- Circle Diagrams | Circle Spoke Diagram Template | How to Add a ...
- 3 Circle Venn Diagram Maker
- How to Draw a Circular Arrows Diagram Using ConceptDraw PRO ...
- Pie Chart Software | How to Draw a Pie Chart Using ConceptDraw ...
- What Is a Circle Spoke Diagram
- How to Draw a Circular Arrows Diagram Using ConceptDraw PRO ...
- Examples of Flowcharts, Org Charts and More | Pie Chart Software ...
- Water Circle Diagram
- Circular Arrows Diagrams | Arrow circle chart - Template | Basic ...
- Circular Flow Diagram Template | Arrow circle chart - Template ...
- Software Free Circular Diagram Mac
- Arrow circle chart - Template | Circular diagrams - Vector stencils ...
- How to Add a Circle -spoke Diagram to a PowerPoint Presentation ...
- Circular diagrams - Vector stencils library | Pie Chart Examples and ...