3 Circle Venn. Venn Diagram Example
This example shows the 3 Circle Venn Diagram. The Venn Diagrams visualize all possible logical intersections between several sets. On this example you can see the intersections of 3 sets. Venn Diagrams are widely used in mathematics, logic, statistics, marketing, sociology, etc.3 Circle Venn Diagram. Venn Diagram Example
This template shows the Venn Diagram. It was created in ConceptDraw PRO diagramming and vector drawing software using the ready-to-use objects from the Venn Diagrams Solution from the "What is a Diagram" area of ConceptDraw Solution Park. Venn Diagrams visualize all possible logical intersections between several sets and are widely used in mathematics, logic, statistics, marketing, sociology, etc.2 Circle Venn Diagram. Venn Diagram Example
Using the ready-to-use predesigned objects, samples and templates from the Venn Diagrams Solution for ConceptDraw PRO you can create your own professional looking Venn Diagrams quick and easy.Venn Diagram
Venn diagrams are illustrations used in the branch of mathematics known as set theory. They show the mathematical or logical relationship between different groups of things (sets). A Venn diagram shows all the possible logical relations between the sets.What Is a Circle Spoke Diagram
What Is a Circle Spoke Diagram? It is a diagram which have a central item surrounded by other items in a circle. The Circle Spoke Diagrams are often used to show the features or components of the central item in marketing and management documents and presentations. ConceptDraw PRO extended with Circle-Spoke Diagrams Solution from the "What is a Diagram" Area is the best software for creating Circle-Spoke Diagrams.
 Venn Diagrams
Venn Diagrams are actively used to illustrate simple set relationships in set theory and probability theory, logic and statistics, mathematics and computer science, linguistics, sociology, and marketing. Venn Diagrams are also often used to visually summarize the status and future viability of a project.
Circles Venn Diagram
This example shows the 4 Circle Venn Diagram. The Venn Diagram visualizes all possible logical relations between several sets. The sets are represented as circles on the Venn Diagram. On this example you can see the intersections of 4 sets. Venn Diagrams are widely used in mathematics, logic, statistics, marketing, sociology, etc.Venn Diagram Examples for Problem Solving. Venn Diagram as a Truth Table
Venn diagrams are illustrations used in the branch of mathematics known as set theory. They show the mathematical or logical relationship between different groups of things (sets). A Venn diagram shows all the possible logical relations between the sets.Circle Spoke Diagram Template
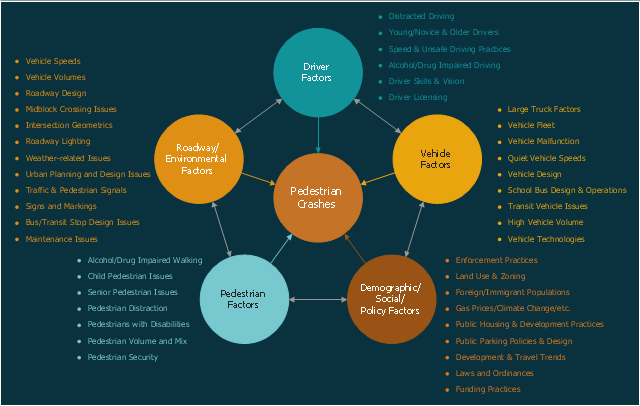
ConceptDraw PRO diagramming and vector drawing software offers the Circle Spoke Diagram Template included in the Circle-Spoke Diagrams Solution from the "What is a Diagram" Area. Use of ready template is the easiest way of drawing professional looking Circle-Spoke Diagrams.This circle-spoke diagram sample shows the factors related to pedestrian safety and morbidity. It was designed on the base of the figure 3 on the webpage "Pedestrian Safety Strategic Plan: Recommendations for Research and Product Development" from the website of the Federal Highway Administration (FHWA) of the U.S. Department of Transportation (DOT).
"Based on the data analysis and literature review, there are a wide variety of factors which contribute to the likelihood of a pedestrian crash. These include factors related to such categories as pedestrians (e.g., pedestrian age, behavior), drivers (e.g., driver distraction), vehicles (e.g., large trucks), roadway environment (e.g., vehicle speeds and volumes, roadway and intersection design), as well as demographic, social, and policy factors (e.g., land use and zoning practices). Some of the primary factors within each of these five categories are given in Figure 3."
[safety.fhwa.dot.gov/ ped_ bike/ pssp/ fhwasa10035/ ]
The hub-and-spoke diagram example "Factors related to pedestrian safety and morbidity" was created using the ConceptDraw PRO diagramming and vector drawing software extended with the Circle-Spoke Diagrams solution from the area "What is a Diagram" of ConceptDraw Solution Park.
Basic Circles Venn Diagram. Venn Diagram Example
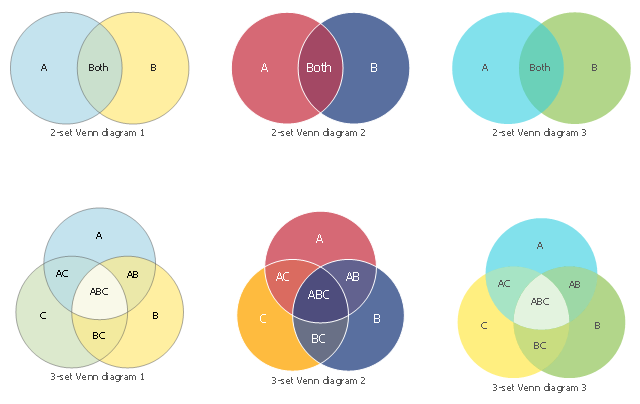
Venn Diagrams visualize all possible logical relations between several sets and are widely used in mathematics, logic, statistics, marketing, sociology, etc. This Venn Diagram shows the relative complement of the set A with respect to the set B. It is the set of the elements in B, but not in A. In other words it is the set-theoretic difference B-A.The vector stencils library "Basic Venn diagrams" contains 6 diagram templates for ConceptDraw PRO diagramming and vector drawing software.
"A Venn diagram is constructed with a collection of simple closed curves drawn in a plane. According to Lewis, the "principle of these diagrams is that classes [or sets] be represented by regions in such relation to one another that all the possible logical relations of these classes can be indicated in the same diagram. That is, the diagram initially leaves room for any possible relation of the classes, and the actual or given relation, can then be specified by indicating that some particular region is null or is not-null".
Venn diagrams normally comprise overlapping circles. The interior of the circle symbolically represents the elements of the set, while the exterior represents elements that are not members of the set. For instance, in a two-set Venn diagram, one circle may represent the group of all wooden objects, while another circle may represent the set of all tables. The overlapping area or intersection would then represent the set of all wooden tables. Shapes other than circles can be employed as shown below by Venn's own higher set diagrams. Venn diagrams do not generally contain information on the relative or absolute sizes (cardinality) of sets; i.e. they are schematic diagrams." [Venn diagram. Wikipedia]
The templates example "Design elements - Basic Venn diagrams" is included in the Basic Venn Diagrams solution from the area "What is a Diagram" of ConceptDraw Solution Park.
Cylinder Venn Diagram
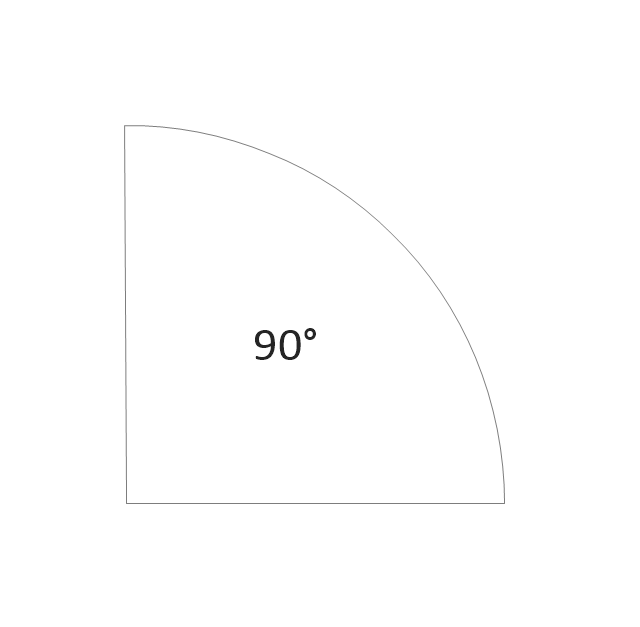
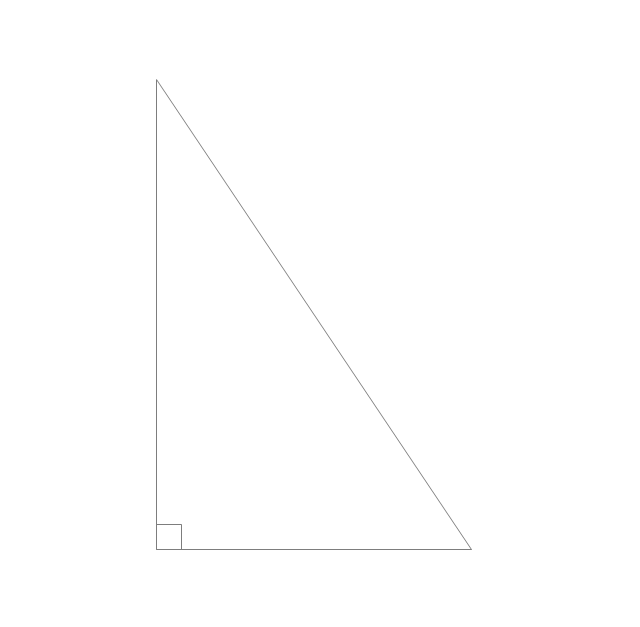
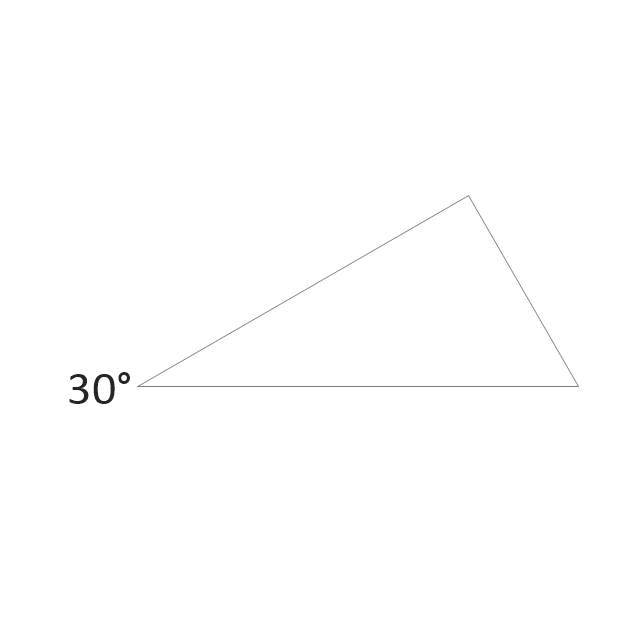
You need design Cylinder Venn Diagram? Nothing could be easier with ConceptDraw PRO diagramming and vector drawing software extended with Venn Diagrams Solution from the “What is a Diagram” Area. ConceptDraw PRO allows you to design various Venn Diagrams including Cylinder Venn Diagrams.The vector stencils library "Plane geometry" contains 27 plane geometric figures.
Use these shapes to draw your geometrical diagrams and illustrations in the ConceptDraw PRO diagramming and vector drawing software extended with the Mathematics solution from the Science and Education area of ConceptDraw Solution Park.
Use these shapes to draw your geometrical diagrams and illustrations in the ConceptDraw PRO diagramming and vector drawing software extended with the Mathematics solution from the Science and Education area of ConceptDraw Solution Park.
HelpDesk
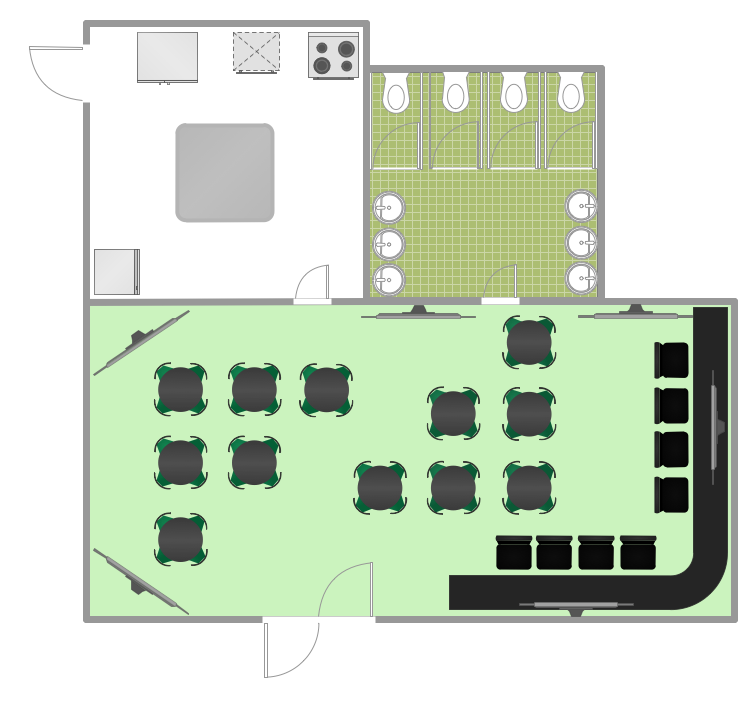
How to Design a Restaurant Floor Plan
Someone might think that creating a plan of cafe or restaurant is quite simple. But in fact it is a real art. You need to make it not only beautiful, but also convenient for visitors. Today, restaurants and cafes are not only the places, where people eat, but a places for business meetings, and recreation. Therefore, a well-designed project of the restaurant (cafe, bar) leads to successful sales and good incomes. The ConceptDraw Cafe and Restaurant Floor Plan solution includes libraries that are tailored for Cafe and Restaurants floor plans and interiors.- Intersection Circles
- Circles Venn Diagram
- Intersection Circle
- 2 Circle Venn Diagrams
- Venn Diagram Template | 3 Circle Venn Diagram. Venn Diagram ...
- 3 Circle Venn Diagram Template
- 3 Circle Venn Diagram Maker
- What Is a Circle Spoke Diagram | Circle Diagrams | Pie Chart ...
- Venn Diagrams Examples 2 Circles
- 3 Circle Venn Diagram. Venn Diagram Example | 3 Circle Venn ...
- Circle Diagrams | How to Add a Circle -spoke Diagram to a ...
- 3 Circles Set
- Plane geometry - Vector stencils library | Pyramid Diagram ...
- Circle Spoke Diagram Template | 3 Circle Venn Diagram. Venn ...
- 3 Circle Venn Diagram. Venn Diagram Example | 2-Set Venn ...
- 3 Circle Venn Diagram. Venn Diagram Example | Venn Diagram ...
- 3 Circle Venn Diagram. Venn Diagram Example
- 3 Circle Venn. Venn Diagram Example
- 3 Circle Venn Diagram Vector
- Circle -Spoke Diagrams


