 Business Intelligence Dashboard
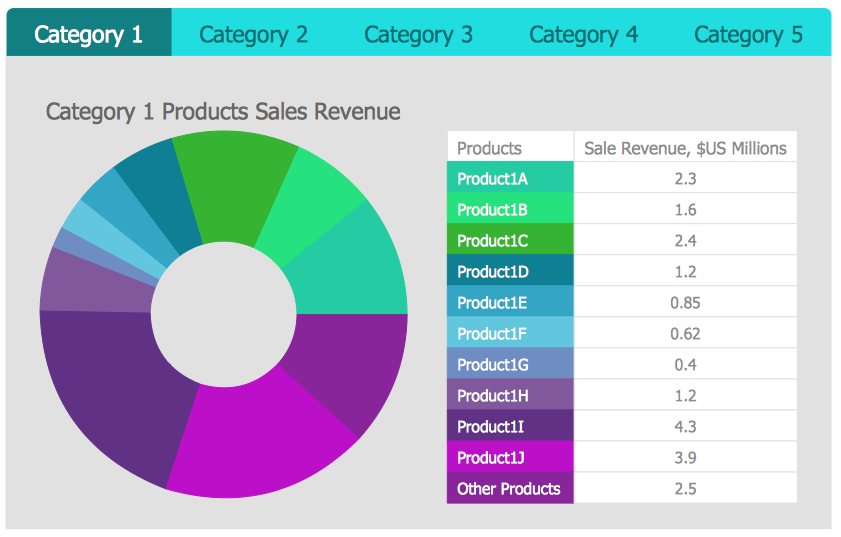
Business Intelligence Dashboard solution extends the ConceptDraw PRO v11 functionality with exclusive tools, numerous ready-to-use vector objects, samples and quick-start templates for creation professional Business Intelligence Dashboards, Business Intelligence Graphics, Business Intelligence Charts and Maps of different kinds. Design easy the BI dashboard, BI model or Dynamic chart in ConceptDraw PRO to monitor the company's work, to track the indicators corresponding your company's data, to display and analyze key performance indicators, to evaluate the trends and regularities of the processes occurring at the company.
 Education Package
Education Package is a comprehensive set of multifarious graphical solutions from ConceptDraw Solution Park, collected together in help to ConceptDraw PRO users working in a field of science, education and training, which is aimed at improving the quality of education and helping to design with ease variety of interesting and colorful educational materials, diagrams, charts and maps. Use it to present the information and knowledge in an interesting, clear, structured and simple form to achieve a success in education and pedagogy, to maintain the interest of students and pupils throughout the whole learning process, at the lectures, lessons and even during independent work with additional materials, to contribute to better perception of scientific information by listeners during the conferences and reports.
 Circle-Spoke Diagrams
Examples of subject areas that are well suited to this approach are marketing, business, products promotion, process modeling, market, resource, time, and cost analysis. Circle-Spoke Diagrams are successfully used in presentations, conferences, management documents, magazines, reportages, reviews, reports, TV, and social media.
 Basic Circle-Spoke Diagrams
Basic circle-spoke diagrams are well suited for marketing, management documents, and presentations.
HelpDesk
How to Make Business Intelligence Dashboard
The business data represented in the view of dashboard can show the real picture of the activity of the entire organization, or it can display particular information like website effectiveness, call center statistics, and more business KPIs in the company. Dashboards provides managers, marketers, and analysts to quickly sort out the position of the company and to determine the weakest links. The dashboard helps to to compare easily different stages of business process and to accomplish the right decision. Business Intelligence Solution for ConceptDraw PRO makes for a powerful analytical tool that displays an organization’s processes and provides valuable competitive insight into business performance.
 ConceptDraw Solution Park
ConceptDraw Solution Park collects graphic extensions, examples and learning materials
 Target and Circular Diagrams
This solution extends ConceptDraw PRO software with samples, templates and library of design elements for drawing the Target and Circular Diagrams.
 Business Processes Area
Solutions of Business Processes area extend ConceptDraw PRO software with samples, templates and vector stencils libraries for drawing business process diagrams and flowcharts for business process management.
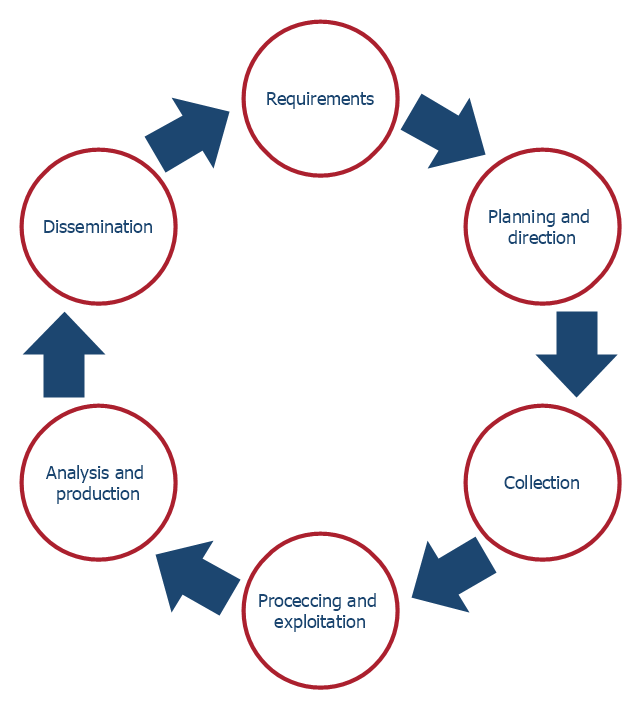
This arrow loop diagram sample was created on the base of the figure illustrating the article "Up Close and Personal. Life as an Intelligence Analyst" from the FBI website. [fbi.gov/ news/ stories/ 2006/ may/ arias050506]
"The traditional Intelligence cycle is the fundamental cycle of intelligence processing in a civilian or military intelligence agency or in law enforcement as a closed path consisting of repeating nodes. The stages of the intelligence cycle include the issuance of requirements by decision makers, collection, processing, analysis, and publication of intelligence. The circuit is completed when decision makers provide feedback and revised requirements. The intelligence cycle is also called the Intelligence Process by the U.S. Department of Defense (DoD) and the uniformed services." [Intelligence cycle. Wikipedia]
The arrow loop diagram example "Intelligence analyst cycle" was created using the ConceptDraw PRO diagramming and vector drawing software extended with the Target and Circular Diagrams solution from the Marketing area of ConceptDraw Solution Park.
www.conceptdraw.com/ solution-park/ marketing-target-and-circular-diagrams
 Pie Charts
Pie Charts are extensively used in statistics and business for explaining data and work results, in mass media for comparison (i.e. to visualize the percentage for the parts of one total), and in many other fields. The Pie Charts solution for ConceptDraw PRO v10 offers powerful drawing tools, varied templates, samples, and a library of vector stencils for simple construction and design of Pie Charts, Donut Chart, and Pie Graph Worksheets.
 Chemical and Process Engineering
This chemical engineering solution extends ConceptDraw PRO v.9.5 (or later) with process flow diagram symbols, samples, process diagrams templates and libraries of design elements for creating process and instrumentation diagrams, block flow diagrams (BFD
 What is a Diagram Area
Solutions of the area What is a Diagram from ConceptDraw Solution Park collect templates, samples and vector stencils libraries for drawing diagrams visualizing qualitative information and knowledge.
 Quality Mind Map
This solution extends ConceptDraw MINDMAP software with Quality Management Mind Maps (Presentations, Meeting Agendas, Problem to be solved).
- Divided Bar Diagrams | Basic Circle -Spoke Diagrams | Stakeholder ...
- Process Flowchart | Block Diagrams | Circle -Spoke Diagrams | How ...
- Draw The Intelligence Cycle And Explain The Circle
- Pie Chart Software | Pie Chart Examples and Templates | Business ...
- Circle -Spoke Diagrams | Best Multi-Platform Diagram Software ...
- Intelligence analyst cycle - Arrow loop diagram | Business ...
- Intelligence analyst cycle - Arrow loop diagram | Target and Circular ...
- Circle Php Script
- Education Package | USA Maps | Circle -Spoke Diagrams ...
- Venn Diagram | 3 Circle Venn Diagram. Venn Diagram Example ...
- Illustration Social Intelligence Examples
- Business Intelligence Dashboard Software | Sales Dashboard ...
- Business Intelligence Dashboard | Intelligence analyst cycle - Arrow ...
- Business Intelligence Cycle
- Process Flowchart | Swim Lane Flowchart Symbols | Loyalty - Arrow ...
- Social Intelligence Diagrams
- Competitor Analysis | Pyramid Chart Examples | Create Graphs and ...
- Business Process Diagrams | Intelligence analyst cycle - Arrow loop ...
- Circle Diagram Of Industrial Development During Plan Period
- Download ER Diagram Of Intelligence Tourism

