Flowchart design. Flowchart symbols, shapes, stencils and icons


Basic Flowchart Symbols and Meaning


This circle diagram sample was redesigned from the Wikimedia Commons file: Research cycle.png. "Some of the basic elements of the scientific method, arranged in a cycle to emphasize that it is an iterative process." [commons.wikimedia.org/ wiki/ File:Research_ cycle.png]
This file is licensed under the Creative Commons Attribution 2.0 Generic license. [creativecommons.org/ licenses/ by/ 2.0/ deed.en]
"The scientific method is a body of techniques for investigating phenomena, acquiring new knowledge, or correcting and integrating previous knowledge. To be termed scientific, a method of inquiry must be based on empirical and measurable evidence subject to specific principles of reasoning. ...
Four essential elements of the scientific method are iterations, recursions, interleavings, or orderings of the following:
(1) Characterizations (observations, definitions, and measurements of the subject of inquiry).
(2) Hypotheses (theoretical, hypothetical explanations of observations and measurements of the subject).
(3) Predictions (reasoning including logical deduction from the hypothesis or theory).
(4) Experiments (tests of all of the above)...
A linearized, pragmatic scheme of the four points above is sometimes offered as a guideline for proceeding:
(1) Define a question.
(2) Gather information and resources (observe).
(3) Form an explanatory hypothesis.
(4) Test the hypothesis by performing an experiment and collecting data in a reproducible manner.
(5) Analyze the data.
(6) Interpret the data and draw conclusions that serve as a starting point for new hypothesis.
(7) Publish results.
(8) Retest (frequently done by other scientists).
The iterative cycle inherent in this step-by-step method goes from point 3 to 6 back to 3 again." [Scientific method. Wikipedia]
The circle diagram example "Research cycle" was created using the ConceptDraw PRO diagramming and vector drawing software extended with the Target and Circular Diagrams solution from the Marketing area of ConceptDraw Solution Park.
www.conceptdraw.com/ solution-park/ marketing-target-and-circular-diagrams
Circle diagram

 Pie Charts
Pie Charts are extensively used in statistics and business for explaining data and work results, in mass media for comparison (i.e. to visualize the percentage for the parts of one total), and in many other fields. The Pie Charts solution for ConceptDraw PRO v10 offers powerful drawing tools, varied templates, samples, and a library of vector stencils for simple construction and design of Pie Charts, Donut Chart, and Pie Graph Worksheets.
UML Activity Diagram

Bar Diagrams for Problem Solving. Create economics and financial bar charts with Bar Graphs Solution

 Circle-Spoke Diagrams
Examples of subject areas that are well suited to this approach are marketing, business, products promotion, process modeling, market, resource, time, and cost analysis. Circle-Spoke Diagrams are successfully used in presentations, conferences, management documents, magazines, reportages, reviews, reports, TV, and social media.
 Floor Plans
Construction, repair and remodeling of the home, flat, office, or any other building or premise begins with the development of detailed building plan and floor plans. Correct and quick visualization of the building ideas is important for further construction of any building.
 Value Stream Mapping
Value stream mapping solution extends ConceptDraw PRO software with templates, samples and vector stencils for drawing the Value Stream Maps (VSM) in lean manufacturing practice.
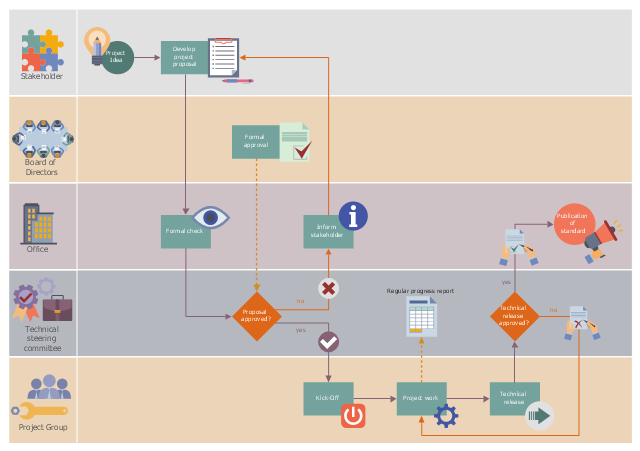
This workflow diagram example was designed on the base of the Wikimedia Commons file: ASAM e.V. flowchart.png.
"Life cycle of an ASAM standard." [commons.wikimedia.org/ wiki/ File:ASAM_ e.V._ flowchart.png]
This file is licensed under the Creative Commons Attribution-Share Alike 3.0 Unported license. [creativecommons.org/ licenses/ by-sa/ 3.0/ deed.en]
"Association for Standardization of Automation and Measuring Systems or ASAM is an incorporated association under German law. Its members are primarily international car manufacturers, suppliers and engineering service providers from the automotive industry. The association coordinates the development of technical standards, which are developed by working groups composed of experts from its member companies. ASAM pursues the vision that the tools of a development process chain can be freely interconnected and allow a seamless exchange of data. The standards define protocols, data models, file formats and application programming interfaces (APIs) for the use in the development and testing of automotive electronic control units." [Association for Standardisation of Automation and Measuring Systems. Wikipedia]
The workflow diagram example "Life cycle of an ASAM standard" was created using ConceptDraw PRO software extended with the Business Process Workflow Diagrams solution from the Business Processes area of ConceptDraw Solution Park.
Workflow diagram
HelpDesk
How To Convert a Circle-Spoke Diagram to Adobe PDF

 Basic Circle-Spoke Diagrams
Basic circle-spoke diagrams are well suited for marketing, management documents, and presentations.
HelpDesk
How to Add a Circle-Spoke Diagram to MS Word Document

- Cycle Process Png
- Research cycle - Circle diagram | Political map of Central America ...
- Research cycle - Circle diagram | U.S. Medicare spending per capita ...
- Circle Arrow Png
- Research cycle - Circle diagram | Export from ConceptDraw PRO ...
- 3d Circle Png
- 6 Arrow Cycle Png
- Pie Charts | DroidDia prime | Pie Chart Software | Circle Graph Png ...
- Diagram Of Good Research Process Circle
- Transparent Circle Png
- Elements location of a welding symbol | Research cycle - Circle ...
- Circle White Cloud Png
- Research cycle - Circle diagram | Process Flowchart - Draw Process ...
- 3 Circle Venn Diagram. Venn Diagram Example | Professions ...
- Graphic Design Circles Png
- Rounded Arrow Png
- Circle Png
- 3 Combined Circles Diagram Png
- Colorful Circle Png
- Pie Circle Png