Sales Steps
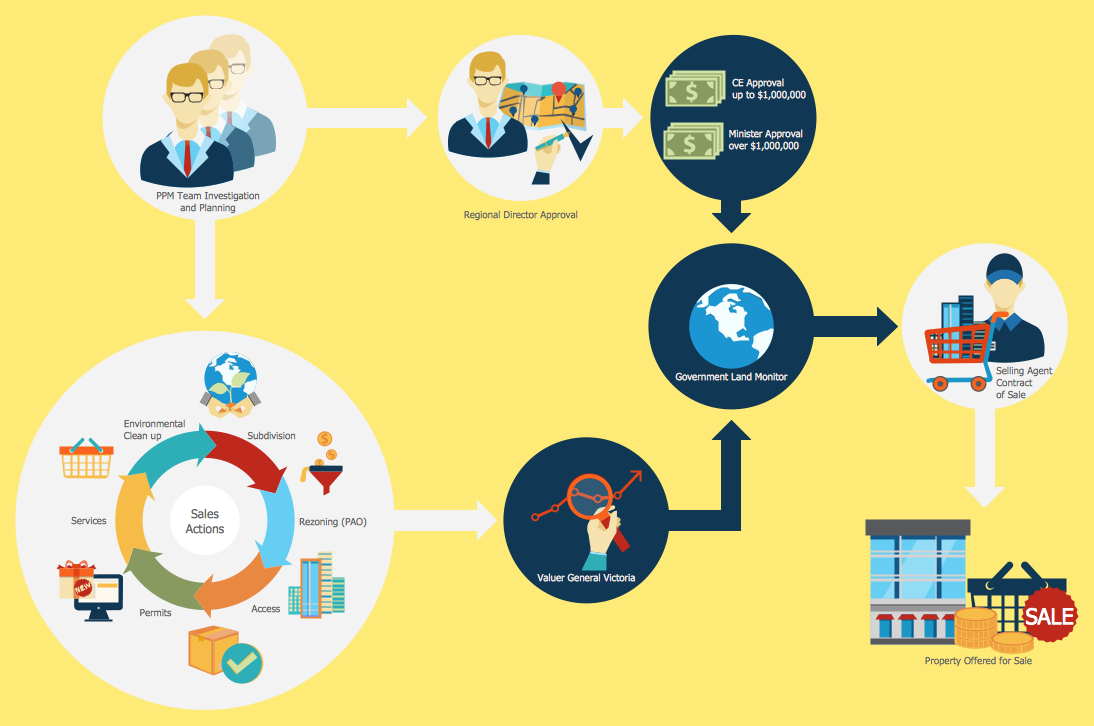
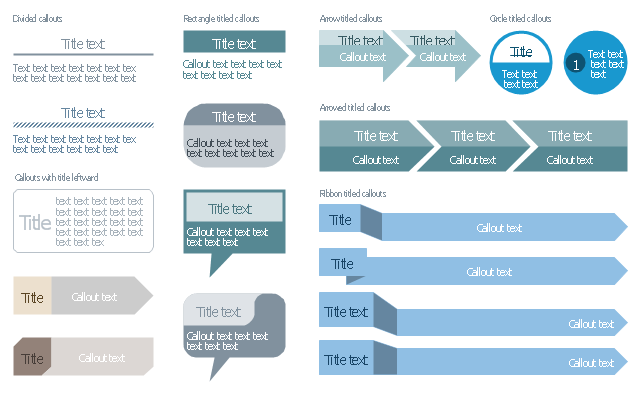
Helps to create professionally looking and detailed Sales Flowcharts with all sales steps visually represented on them. Use the Sales Flowcharts Solution for ConceptDraw PRO software to create your own Sales Flowcharts of any complexity quickly, easily and effectively to use them successfully in your work activity. ConceptDraw PRO diagramming and vector drawing software supplied with unique Sales Flowcharts solution from the Marketing area of ConceptDraw Solution Park allows fast and easy visualize all sales steps of the sales process on a sales process Map or sales process flowchart, and then realize them easily.The vector stencils library "Education titled callouts" contains 14 titled callout blocks.
Use it to design your educational infograms.
"In publishing, a call-out or callout is a short string of text connected by a line, arrow, or similar graphic to a feature of an illustration or technical drawing, and giving information about that feature. The term is also used to describe a short piece of text set in larger type than the rest of the page and intended to attract attention.
A similar device in word processing is a special text box with or without a small "tail" that can be pointed to different locations on a document." [Callout. Wikipedia]
The shapes example "Design elements - Education titled callouts" was created using the ConceptDraw PRO diagramming and vector drawing software extended with the Education Infographics solition from the area "Business Infographics" in ConceptDraw Solution Park.
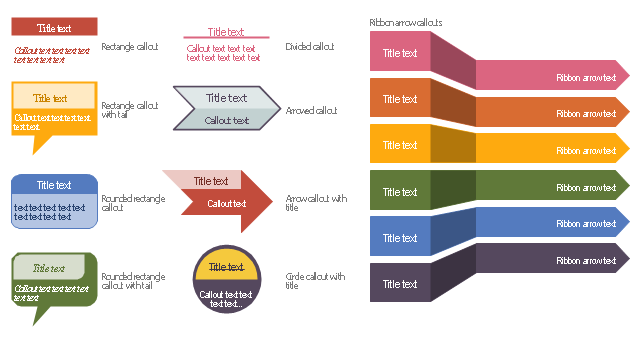
The vector stencils library "Management titled callouts" contains 20 divided rectangle callouts, rounded rectangle callouts, circle callouts, speech balloons, arrow callouts.
Use it to create your management infograms.
The infographic shapes example "Design elements - Management titled callouts" was created using the ConceptDraw PRO diagramming and vector drawing software extended with the Management Infographics solition from the area "Business Infographics" in ConceptDraw Solution Park.
The vector stencils library "Winter Olympics pictograms" contains 29 pictograms and silhouettes.
Use it for drawing Winter Olympics diagrams, infographics and illustrations in the ConceptDraw PRO diagramming and vector drawing software extended with the Winter Sports solution from the Sport area of ConceptDraw Solution Park.
Use it for drawing Winter Olympics diagrams, infographics and illustrations in the ConceptDraw PRO diagramming and vector drawing software extended with the Winter Sports solution from the Sport area of ConceptDraw Solution Park.
 Presentation Exchange
This solution extends ConceptDraw MINDMAP software with the ability to import presentations from Microsoft PowerPoint, as well as enhancing its existing presentation capabilities.
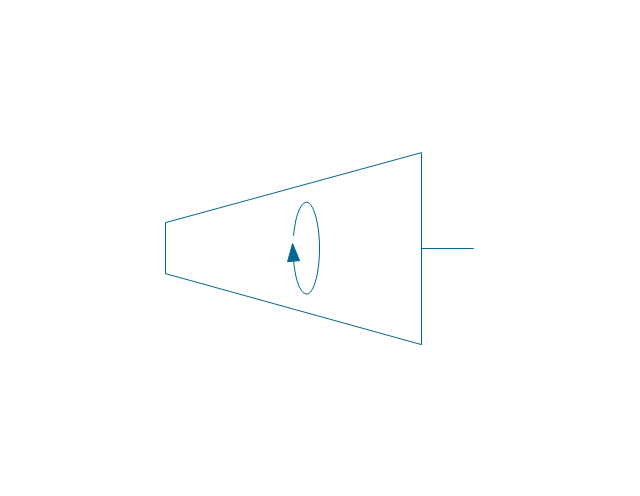
The vector stencils library "Industrial equipment" contains 81 symbols of pumps, compressors, fans, turbines, and power generators.
Use these shapes to design pumping systems, air and fluid compression systems, and industrial process diagrams in the ConceptDraw PRO software extended with the Chemical and Process Engineering solution from the Chemical and Process Engineering area of ConceptDraw Solution Park.
www.conceptdraw.com/ solution-park/ engineering-chemical-process
HelpDesk
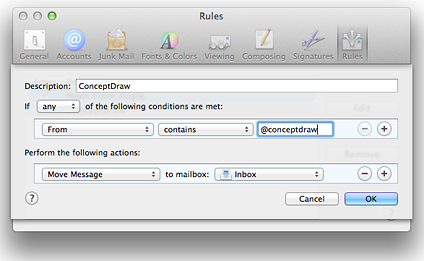
How to Add conceptdraw.com Domain to Custom Safe Senders List
Instruction on how to add the csodessa to your safe senders list in order to help ensure that you receive CS Odessa email that confirms your successful registration.HelpDesk
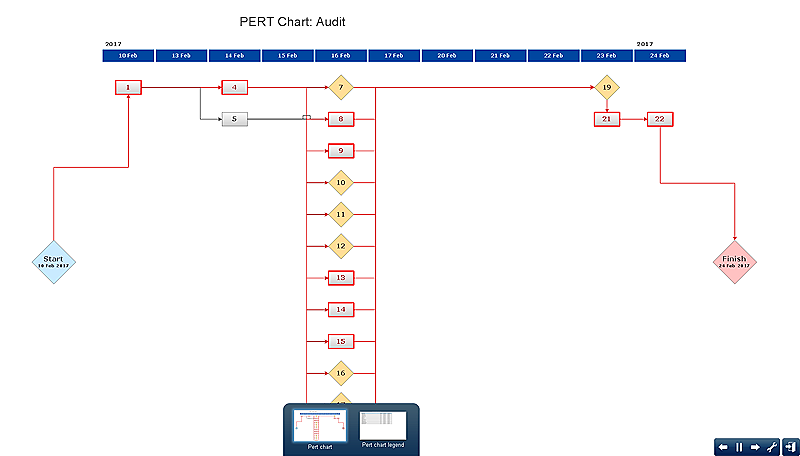
How to Create Project Diagrams on PC
Visual diagrams gives the ability to view at a detailed level project attributes such as project scope, logical connections in the project, critical paths, key events on the timeline, milestones, tasks, calendars for work, and resource utilization.HelpDesk
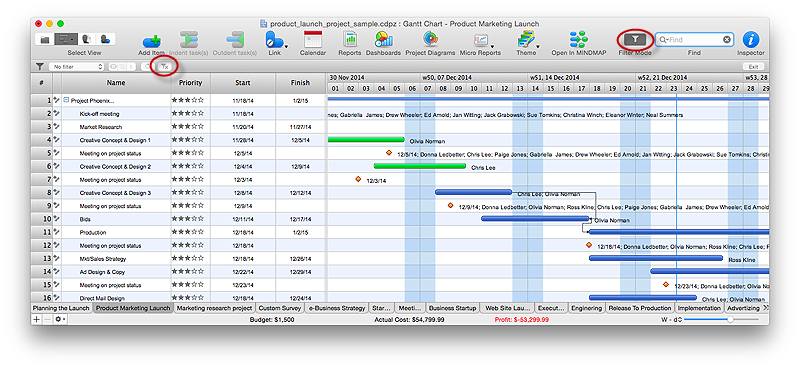
Embedded Filtering Capabilities in ConceptDraw PROJECT for Macintosh
The embedded filters of ConceptDraw PROJECT can be very useful for viewing a specific range of information. You can apply filters to tasks, resources and even projects.The vector stencils library "Sales arrows" contains 57 arrow symbols.
Use these arrow icon set to draw your sales flowcharts, workflow diagrams and process charts with the ConceptDraw PRO diagramming and vector drawing software.
The arrow pictograms library "Sales arrows" is included in the Sales Flowcharts solution from the Marketing area of ConceptDraw Solution Park.
HelpDesk
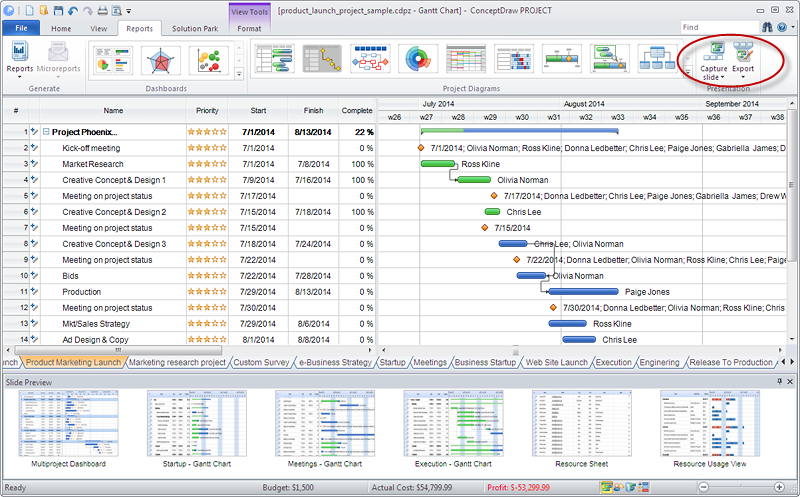
How to Get Images for Project Presentation on Windows
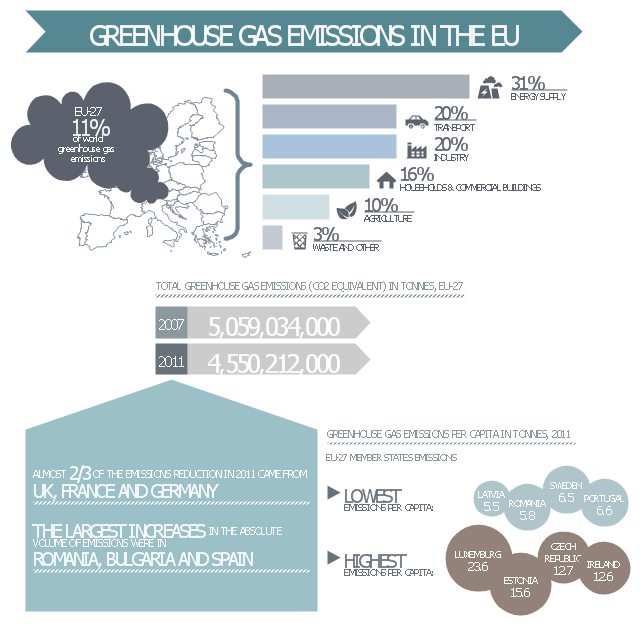
ConceptDraw PROJECT allows you to easily make slides for presentation.This ecology infographic example was created on the base of the infographics "Greenhouse gas emissions in the EU" from the Debating Europe website. [debatingeurope.eu/ wp-content/ uploads/ 2013/ 06/ TH_ 2_ social.png]
"A greenhouse gas (sometimes abbreviated GHG) is a gas in an atmosphere that absorbs and emits radiation within the thermal infrared range. This process is the fundamental cause of the greenhouse effect. The primary greenhouse gases in the Earth's atmosphere are water vapor, carbon dioxide, methane, nitrous oxide, and ozone. Greenhouse gases greatly affect the temperature of the Earth; without them, Earth's surface would average about 33 °C colder, which is about 59 °F below the present average of 14 °C (57 °F)." [Greenhouse gas. Wikipedia]
The ecology infographic example "EU greenhouse gas emissions" was created using the ConceptDraw PRO diagramming and vector drawing software extended with the Management Infographics solition from the area "Business Infographics" in ConceptDraw Solution Park.
Used Solutions
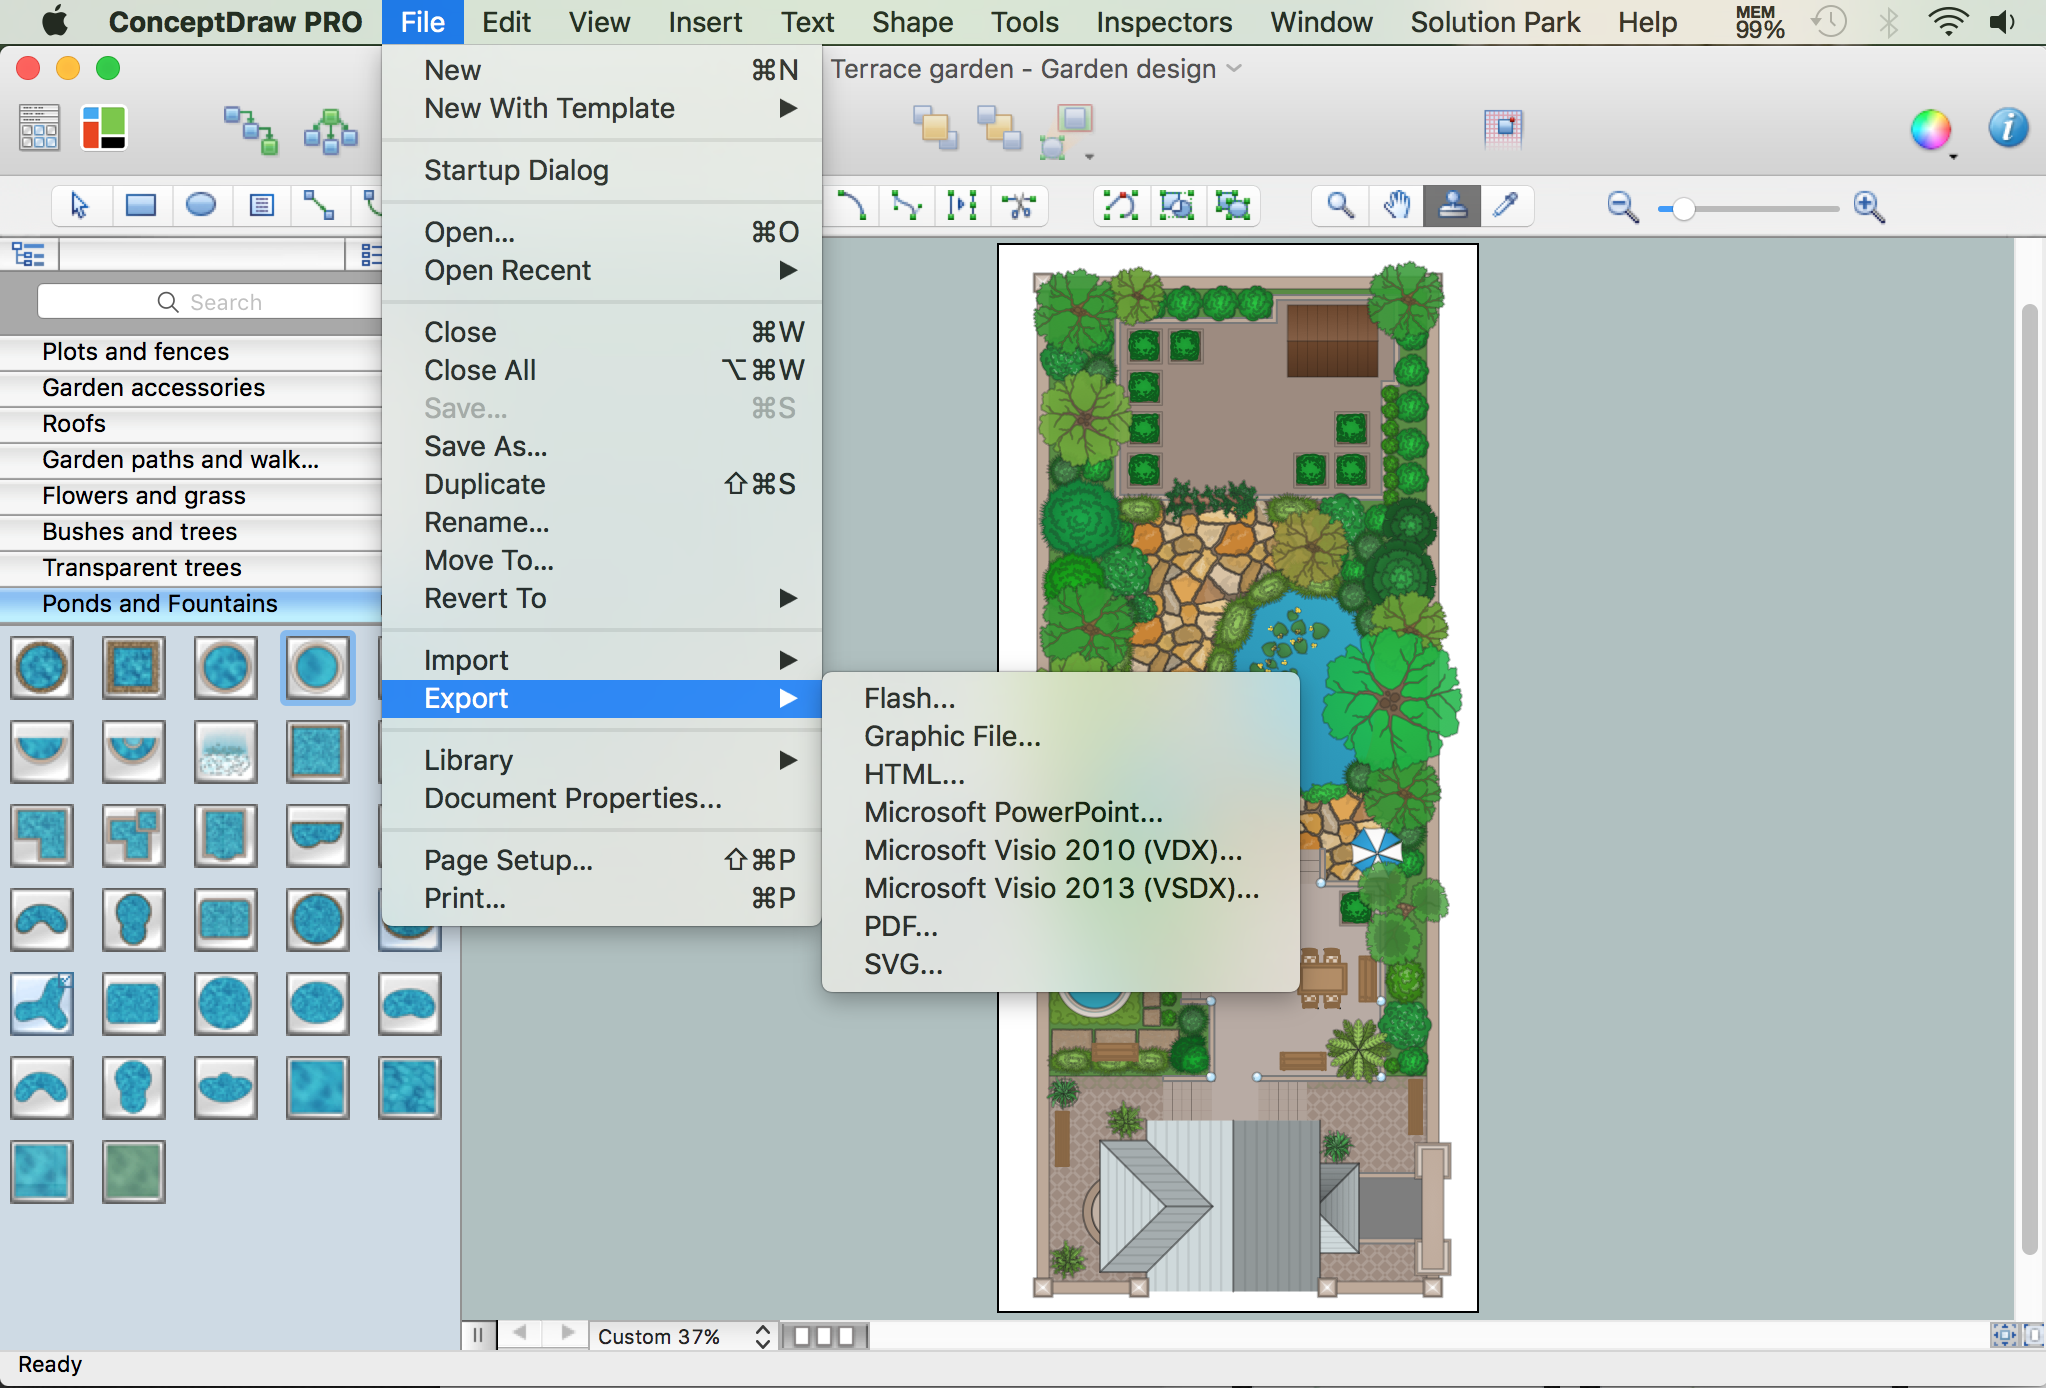
How to Draw a Landscape Design Plan
What is landscape design? It's a floor plan but for an outdoor area. Same as a floor plan, a landscape design represents visually any site using scaled dimensions. The main purpose of landscape design is to plan the layout for an outdoor area no matter is it a personal site plan for your home or a commercial plan for business. It may also be handful when a new installation, repair or even an outdoor event is planning. It helps to calculate time and decide which materials should be used in your project. Landscape designs perfectly gives the property owner and landscape contractor better vision for cost estimation, helping to ensure the project time and budget.HelpDesk
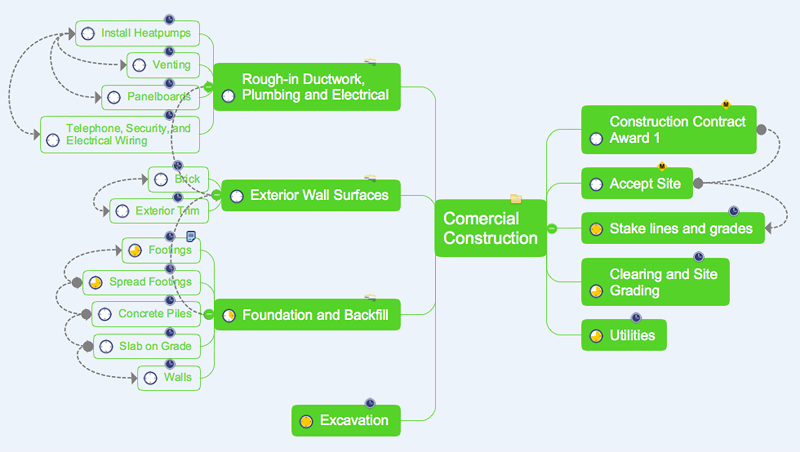
How to Make a Mind Map from a Project Gantt Chart
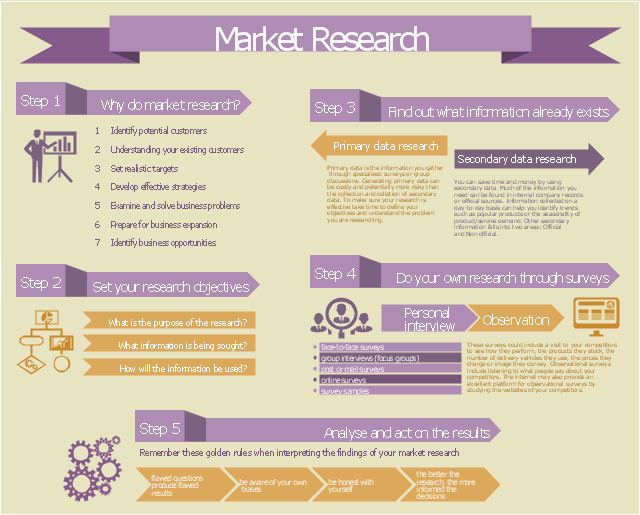
ConceptDraw Office allows you to see the project data from ConceptDraw PROJECT in a mind map structure by opening your project in ConceptDraw MINDMAP.This example of marketing infogram was created on the base of web page "Market research" from the website of West Australian State Government agency Small Business Development Corporation (SBDC).
"Market research is a key part of developing your marketing strategy. It’s about collecting information to give you an insight into your customers’ mind so that you understand what they want, how they gather information and where they come from. You can also do market research to get a better idea of market trends and what is happening in your industry sector.
The information you gather and analyse builds the foundation of good business decisions whether it’s deciding what product or service you’ll offer, where your business should be located, how to distribute your products or how you communicate with consumers." [smallbusiness.wa.gov.au/ market-research]
The example "Marketing Infographics - Market Research" was created using the ConceptDraw PRO diagramming and vector drawing software extended with the Marketing Infographics solition from the area "Business Infographics" in ConceptDraw Solution Park.
- Ribbon Circle Png
- Circle Text Blocks
- Curved Arrow Circle Clip Art
- Hierarchy of laws | Design elements - Tabbed text blocks | Ribbon ...
- Ribbon interface - Vector stencils library | Graphic User Interface ...
- Rectangular Ribbon Png
- Medicine and health pictograms - Vector stencils library | Medicine ...
- Title Ribbon Png
- Ribbon Designs Png
- Design elements - Education titled callouts | Design elements ...
- Winter Olympics pictograms - Vector stencils library | How to Draw a ...
- Basic Flowchart Symbols and Meaning | Design elements ...
- Landscape & Garden | Building Design Package | Semi Circle Ring ...
- Ribbon interface - Vector stencils library | Sales arrows - Vector ...
- Dna Circle Helix Mouse
- Ice Hockey Diagram – Deke Technique | Ice hockey rink view from ...
- Circle Arrow Cycle Clipart
- Ribbon Screw Conveyor
- Half Circle Clip Art
- Circle Arrow Icon
