HelpDesk
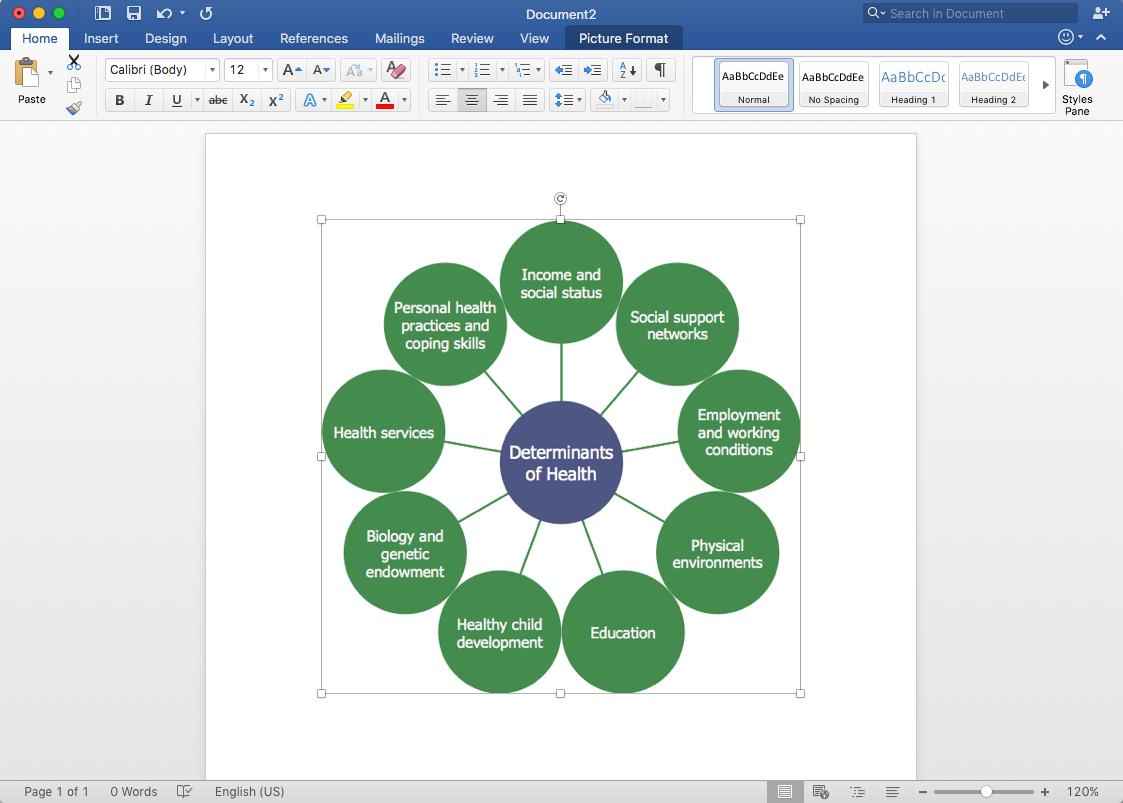
How to Add a Circle-Spoke Diagram to MS Word Document
ConceptDraw PRO allows you to easily create various marketing charts, including the circle-spoke diagrams and then insert them into a MS Word document.HelpDesk
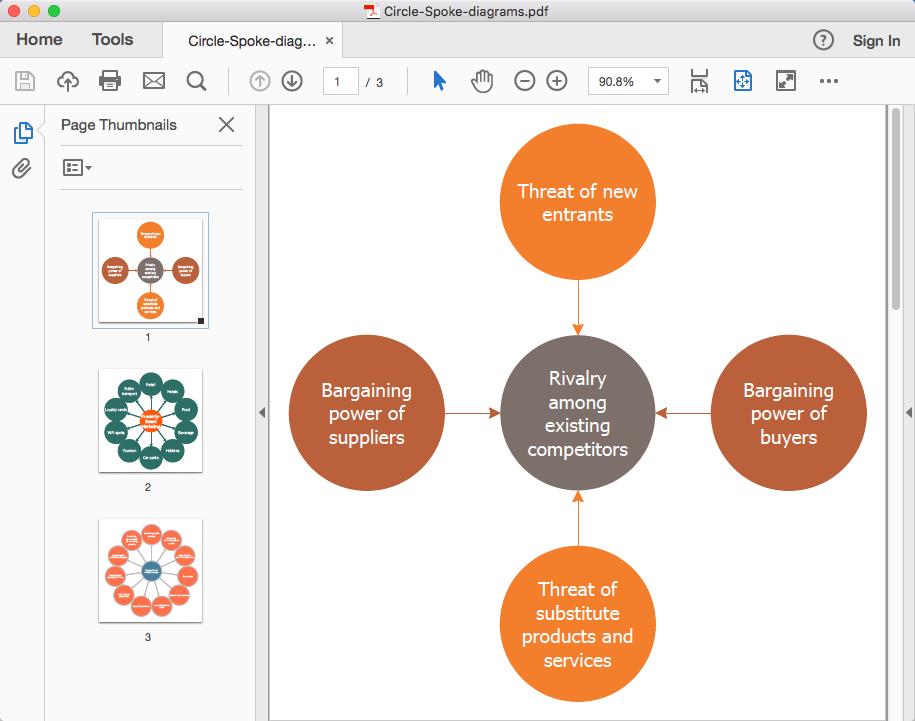
How To Convert a Circle-Spoke Diagram to Adobe PDF
ConceptDraw PRO allows you to easy share your marketing documentation between different computers with different operating systems and applications using it's export capabilities. You can get your marketing diagrams in pdf format and avoid any problems while communicating them.Pie Chart Examples and Templates
A pie chart or a circle graph is a circular chart divided into sectors, illustrating numerical proportion. In a pie chart, the arc length of each sector and consequently its central angle and area, is proportional to the quantity it represents. Pie chart examples and templates created using ConceptDraw PRO software helps you get closer with pie charts and find pie chart examples suite your needs.Venn Diagram Template for Word
This template shows the Venn Diagram. It was created in ConceptDraw PRO diagramming and vector drawing software using the ready-to-use objects from the Venn Diagrams Solution from the "Diagrams" area of ConceptDraw Solution Park.Venn Diagram Examples for Problem Solving. Venn Diagram as a Truth Table
Venn diagrams are illustrations used in the branch of mathematics known as set theory. They show the mathematical or logical relationship between different groups of things (sets). A Venn diagram shows all the possible logical relations between the sets.Pie Chart Word Template. Pie Chart Examples
The Pie Chart visualizes the data as the proportional parts of a whole and looks like a disk divided into sectors. The pie chart is type of graph, pie chart looks as circle devided into sectors. Pie Charts are widely used in the business, statistics, analytics, mass media. It’s very effective way of displaying relative sizes of parts, the proportion of the whole thing.Bar Chart Template for Word
All these bar chart templates are included in the Bar Graphs solution. You can quickly rework these bar graph templates into your own charts by simply changing displayed data, title and legend texts.Venn Diagram Maker
ConceptDraw PRO diagramming and vector drawing software extended with Venn Diagrams solution from the "Diagrams" area of ConceptDraw Solution Park is a powerful Venn Diagram maker. Create fast and easy your own Venn Diagrams to visualize: all the possible logical relations between sets, simple set relationships in logic, statistics, mathematics, sociology, marketing, summarize the status and future viability of a project.HelpDesk
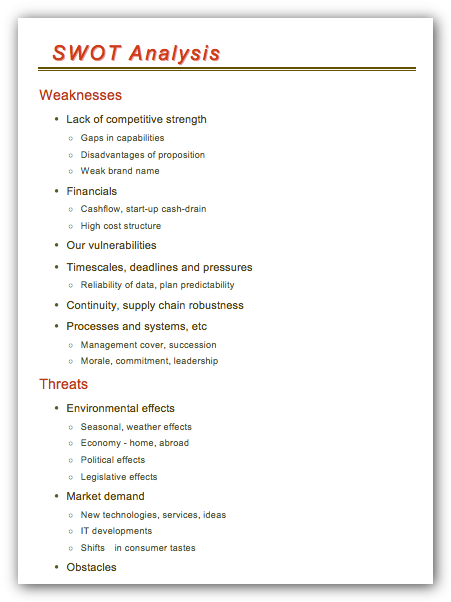
How to Make SWOT Analysis in a Word Document
A SWOT analysis is a strategic planning tool that helps to identify and compare strengths and weaknesses with opportunities and threats to make a decision and create an action plan. When performing a SWOT analysis, one can create a table split up into four columns so as to list each impacting element side-by-side for comparison, but typically it is conducted using a four-square SWOT analysis template. Using mind map allows you to collect and structure an information involved in SWOT Analysis then, you can export your SWOT mind map into a MS Word document that allows you to present and collaborate your business strategic SWOT analysis matrix in MS Word document.How To Create Onion Diagram
An onion diagram is a kind of chart that shows the dependencies among parts of an organization or process. The chart displays items in concentric circles, where the items in each ring depend on the items in the smaller rings. The Onion Diagram is able to show layers of a complete system in a few circles. But how to create Onion Diagram? Now, it's very easy thanks to the ConceptDraw PRO diagramming and vector drawing software extended with Stakeholder Onion Diagrams Solution from the Management Area of ConceptDraw Solution Park.Line Chart Template for Word
This sample was created in ConceptDraw PRO diagramming and vector drawing software using the Line Graphs Solution from Graphs and Charts area of ConceptDraw Solution Park. This sample shows the Line Chart of annual percentage change. The Line Chart allows you to clearly see the changes of data over the time.
 Circle-Spoke Diagrams
Examples of subject areas that are well suited to this approach are marketing, business, products promotion, process modeling, market, resource, time, and cost analysis. Circle-Spoke Diagrams are successfully used in presentations, conferences, management documents, magazines, reportages, reviews, reports, TV, and social media.
Basic Flowchart Symbols and Meaning
Flowcharts are the best for visually representation the business processes and the flow of a custom-order process through various departments within an organization. ConceptDraw PRO diagramming and vector drawing software extended with Flowcharts solution offers the full set of predesigned basic flowchart symbols which are gathered at two libraries: Flowchart and Flowcharts Rapid Draw. Among them are: process, terminator, decision, data, document, display, manual loop, and many other specific symbols. The meaning for each symbol offered by ConceptDraw gives the presentation about their proposed use in professional Flowcharts for business and technical processes, software algorithms, well-developed structures of web sites, Workflow diagrams, Process flow diagram and correlation in developing on-line instructional projects or business process system. Use of ready flow chart symbols in diagrams is incredibly useful - you need simply drag desired from the libraries to your document and arrange them in required order. There are a few serious alternatives to Visio for Mac, one of them is ConceptDraw PRO. It is one of the main contender with the most similar features and capabilities.
Venn Diagram
Venn diagrams are illustrations used in the branch of mathematics known as set theory. They show the mathematical or logical relationship between different groups of things (sets). A Venn diagram shows all the possible logical relations between the sets.Ansoff Matrix
ConceptDraw PRO software extended with Matrices Solution from the Marketing Area of ConceptDraw Solution Park offers you the possibility to develop the Ansoff Matrix of any complexity.- Venn Diagram Template for Word | How to Add a Circle -Spoke ...
- Arrow circle chart - Template | Pie Chart Examples and Templates ...
- Venn Diagram Template for Word | Circle Spoke Diagram Template ...
- Venn Diagram Template for Word | Logic gate diagram - Template ...
- Venn Diagram Template for Word | Venn Diagram | 3 Circle Venn ...
- Venn Diagram | Venn Diagram Template for Word | 3 Circle Venn ...
- Venn Diagram Template for Word | 3 Circle Venn. Venn Diagram ...
- Venn Diagram | Venn Diagram Template for Word | Basic Circles ...
- Circle Spoke Diagram Template | Pie Chart Word Template . Pie ...
- Four Circle Venn Diagram Template
- Venn Diagram Template | Circle Spoke Diagram Template | Venn ...
- Donut Circle Chart Template
- Venn Diagram Template for Word | Basic Circles Venn Diagram ...
- Basic Circles Venn Diagram. Venn Diagram Example | Venn ...
- Venn Diagram Template | Basic Circles Venn Diagram . Venn ...
- Pie Chart Word Template
- Venn Diagram Template for Word | Venn Diagrams | 5-Set Venn ...
- 5-Set Venn diagram - Template | Venn Diagram Template for Word ...
- Process Flowchart | How to Draw a Circle -Spoke Diagram Using ...
- Create Market Analysis Pie Template


