HelpDesk
How to Create a Timeline Diagram in ConceptDraw PRO

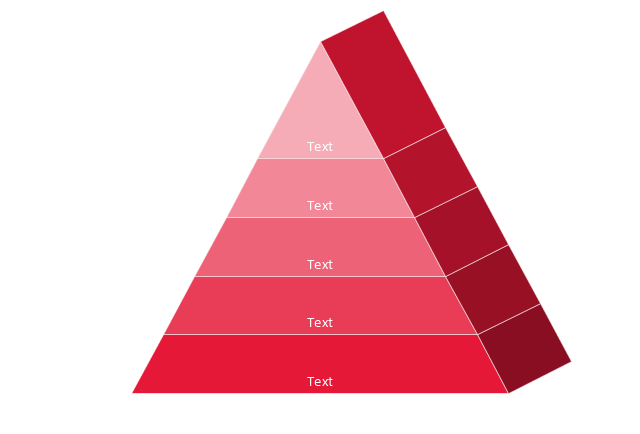
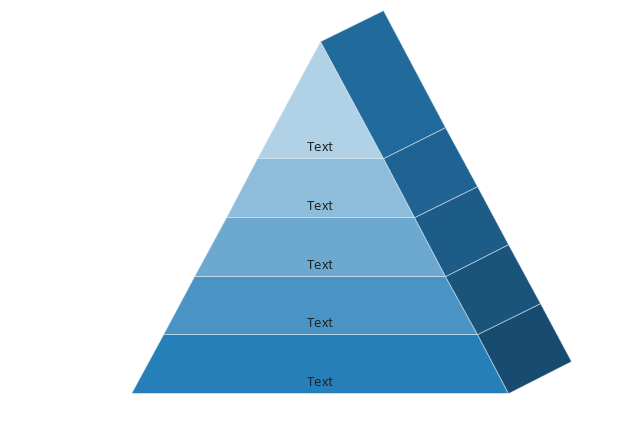
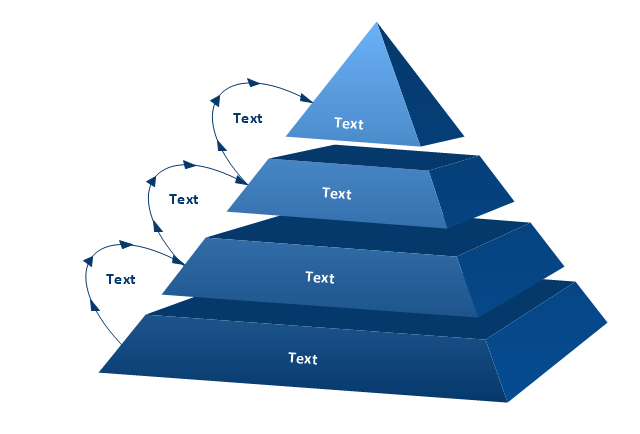
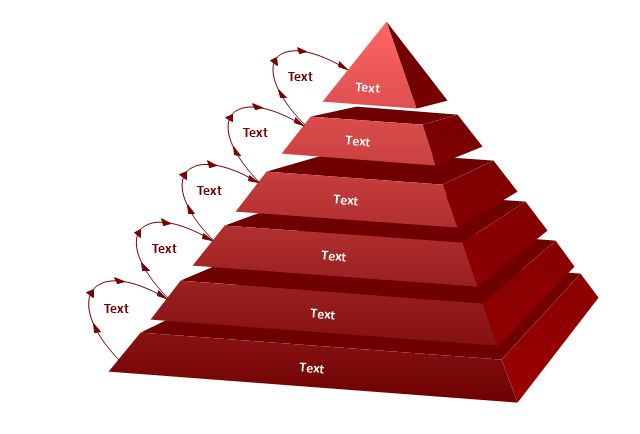
The vector stencils library "Pyramid diagrams" contains 28 templates of pyramid diagrams, triangle charts and triangular schemes.
Use these templates to create your pyramid diagrams in the ConceptDraw PRO diagramming and vector drawing software extended with the Pyramid Diagrams solution from the Marketing area of ConceptDraw Solution Park.
Use these templates to create your pyramid diagrams in the ConceptDraw PRO diagramming and vector drawing software extended with the Pyramid Diagrams solution from the Marketing area of ConceptDraw Solution Park.
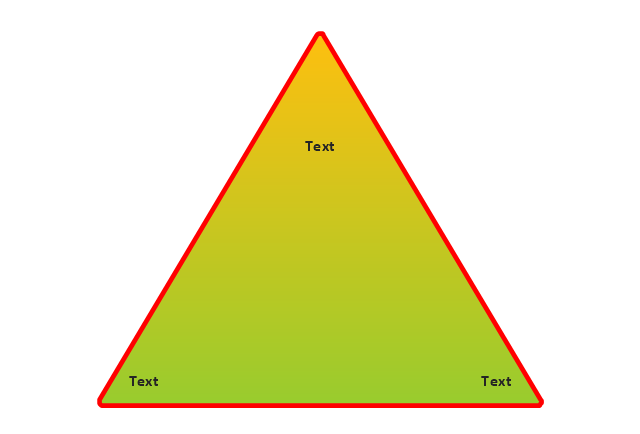
Pyramid 1
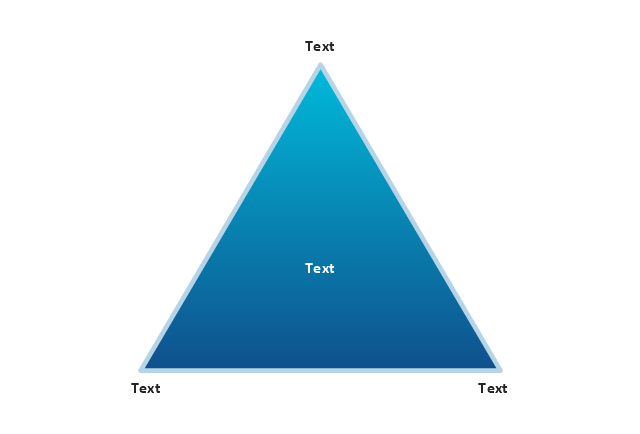
Pyramid 2
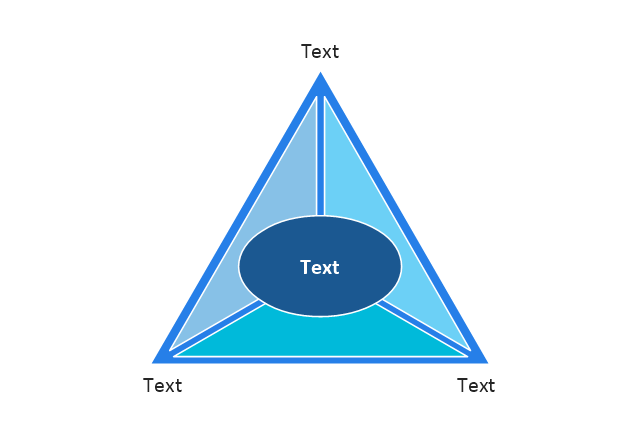
Pyramid 3
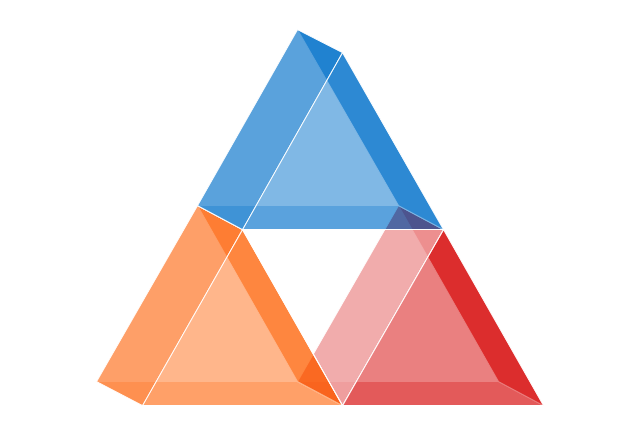
Pyramid 4
Pyramid 5
Pyramid 1 Isometric
Pyramid 2 Isometric
Pyramid 3 Isometric
Pyramid 4 Isometric
Pyramid 5 Isometric
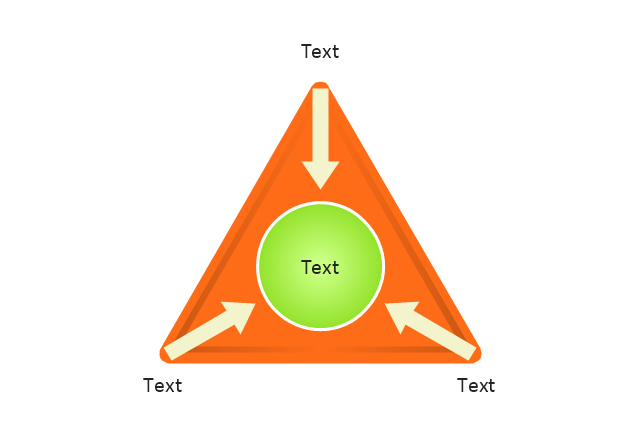
Triangle diagram, arrows
Triangle diagram
Triangular pyramid
Triangular diagram
Triangle scheme
Triangle chart

Triangle chart, isometric
Triangular scheme
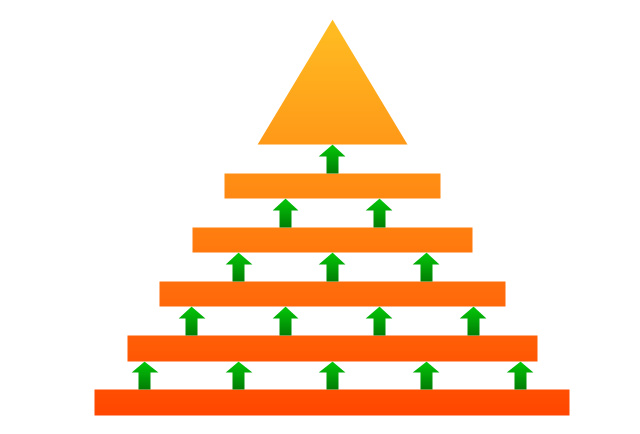
Arrowed block pyramid
Funnel diagram
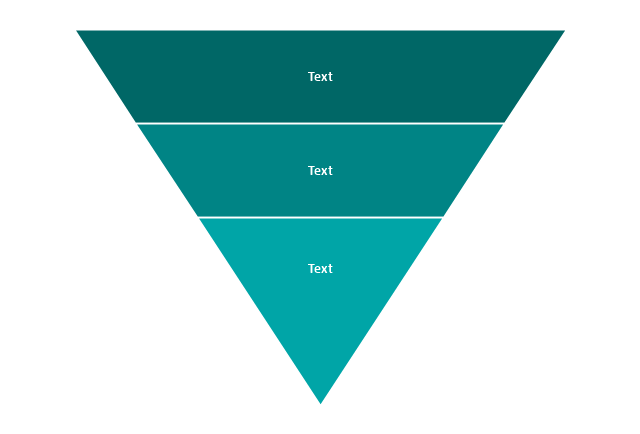
3-level funnel diagram
4-level funnel diagram
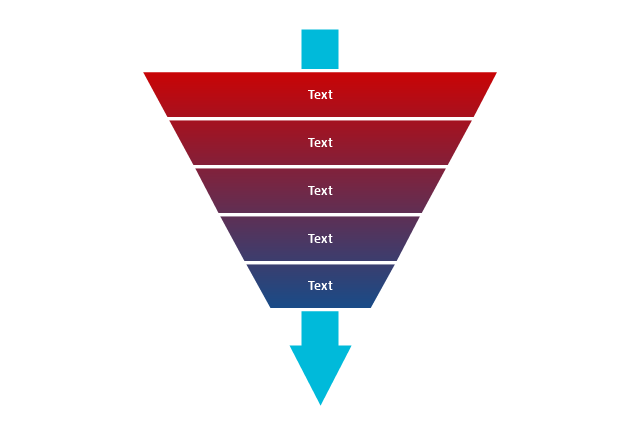
5-level funnel diagram
2-level pyramid diagram
3-level pyramid diagram
4-level pyramid diagram
5-level pyramid diagram
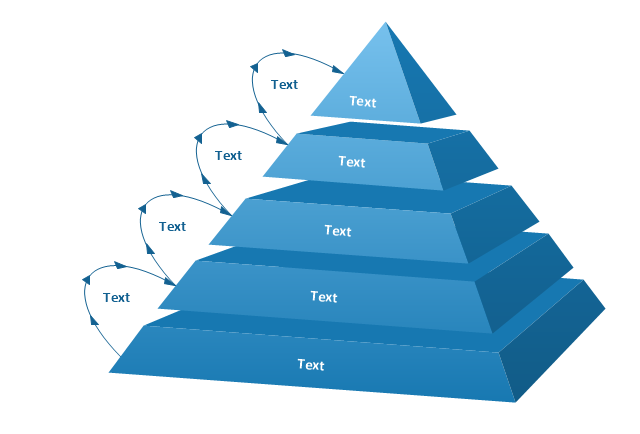
6-level pyramid diagram
Basic Flowchart Symbols and Meaning


Pyramid Diagram

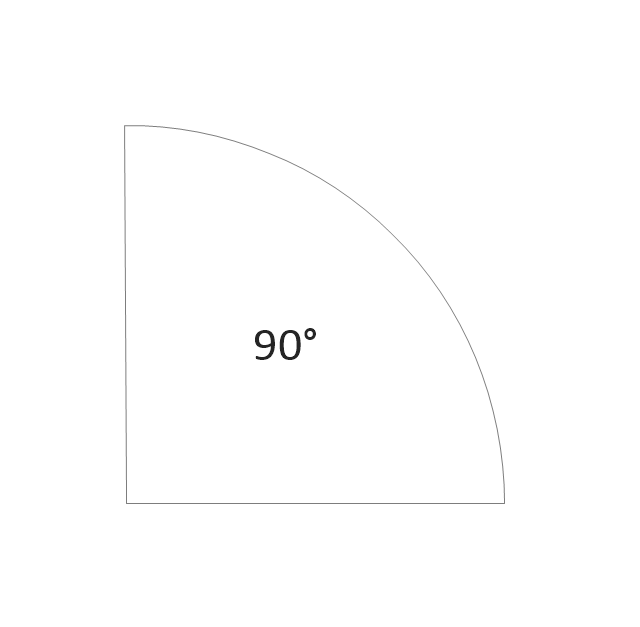
The vector stencils library "Plane geometry" contains 27 plane geometric figures.
Use these shapes to draw your geometrical diagrams and illustrations in the ConceptDraw PRO diagramming and vector drawing software extended with the Mathematics solution from the Science and Education area of ConceptDraw Solution Park.
Use these shapes to draw your geometrical diagrams and illustrations in the ConceptDraw PRO diagramming and vector drawing software extended with the Mathematics solution from the Science and Education area of ConceptDraw Solution Park.
Circular sector
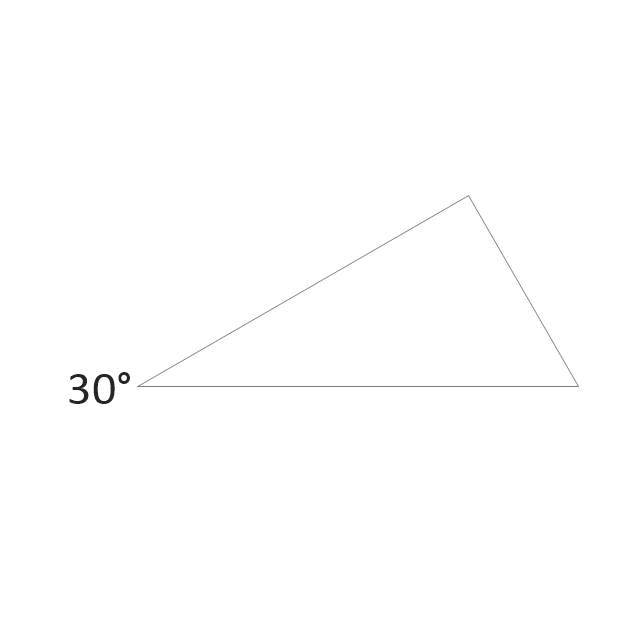
Right triangle
Rectangle

Square

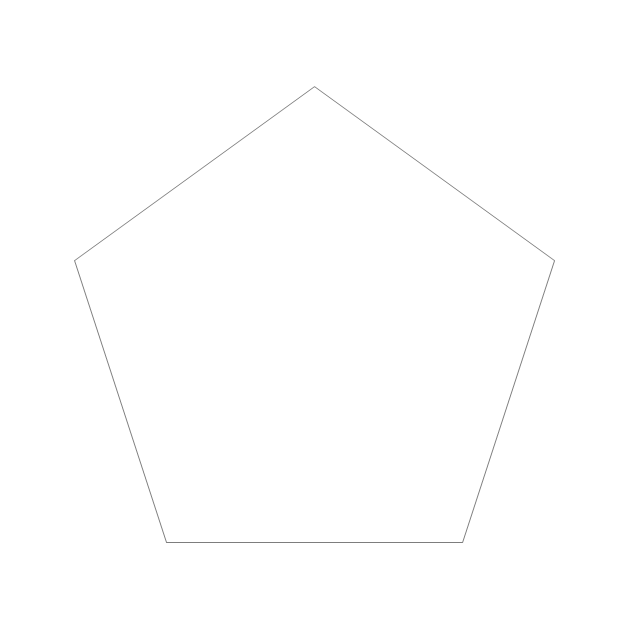
Pentagon
Isosceles trapezium
Parallelogram

Trapezium
Three-pointed star

Four-pointed star

Five-pointed star

Six-pointed star

Seven-pointed star

Eight-pointed star

Triangle
Equilateral triangle
Right triangle 2
Right triangle, angle box
Right triangle 3
Hexagon

Regular hexagon

Regular pentagon
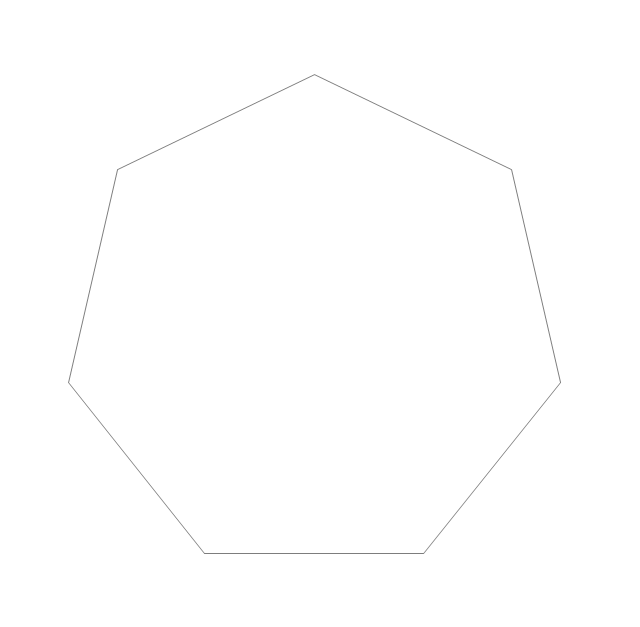
Regular heptagon
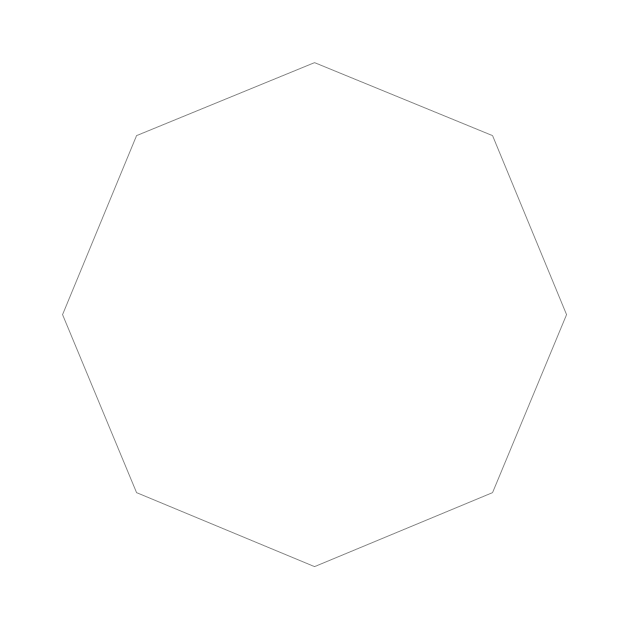
Regular octagon
Rhombus

Circle

Ellipse

UML Class Diagram Constructor

Flowchart design. Flowchart symbols, shapes, stencils and icons


Process Flowchart


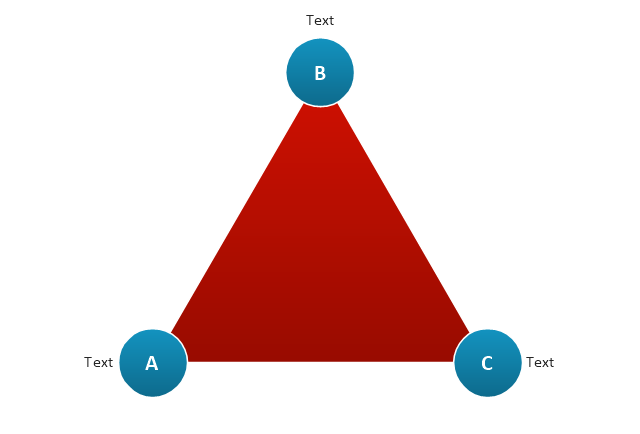
"The Time/ Money/ Quality Triangle illustrates an advertising truism, that "you can't have all three." If there is little time or money, then ad quality will suffer. The more time and/ or money that is available to the project, the higher the quality can be. However, the level of quality must be appropriate to the product...not all products should have high-quality ads!" [Advertising/ Strategies. Wikibooks]
This triangular diagram example was redesigned using the ConceptDraw PRO diagramming and vector drawing software from Wikimedia Commons file Time-Quality-Money.png. [commons.wikimedia.org/ wiki/ File:Time-Quality-Money.png]
This file is licensed under the Creative Commons Attribution-Share Alike 3.0 Unported license. [creativecommons.org/ licenses/ by-sa/ 3.0/ deed.en]
The chart sample "Time, quality, money triangle diagram" is included in the Pyramid Diagrams solution from the Marketing area of ConceptDraw Solution Park.
Triangular chart

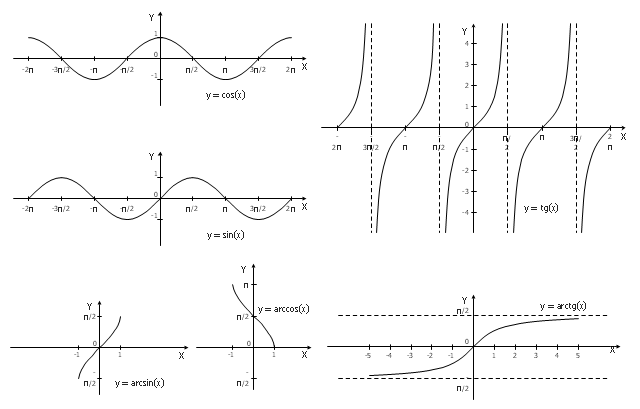
The vector stencils library "Trigonometric functions" contains 8 shapes of trigonometrical and inverse trigonometrical functions graphs.
"In mathematics, the trigonometric functions (also called the circular functions) are functions of an angle. They relate the angles of a triangle to the lengths of its sides. Trigonometric functions are important in the study of triangles and modeling periodic phenomena, among many other applications.
The most familiar trigonometric functions are the sine, cosine, and tangent. In the context of the standard unit circle with radius 1 unit, where a triangle is formed by a ray originating at the origin and making some angle with the x-axis, the sine of the angle gives the length of the y-component (the opposite to the angle or the rise) of the triangle, the cosine gives the length of the x-component (the adjacent of the angle or the run), and the tangent function gives the slope (y-component divided by the x-component). More precise definitions are detailed below. Trigonometric functions are commonly defined as ratios of two sides of a right triangle containing the angle, and can equivalently be defined as the lengths of various line segments from a unit circle. More modern definitions express them as infinite series or as solutions of certain differential equations, allowing their extension to arbitrary positive and negative values and even to complex numbers." [Trigonometric functions. Wikipedia]
The shapes example "Design elements - Trigonometric functions" was created using the ConceptDraw PRO diagramming and vector drawing software extended with the Mathematics solution from the Science and Education area of ConceptDraw Solution Park.
Trigonometrical and inverse trigonometrical functions - Graphs
Pyramid Diagram

Circular Diagram

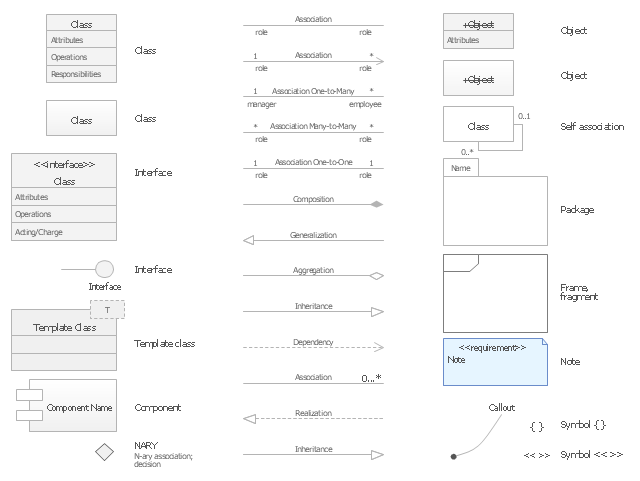
The vector stencils library "UML class diagrams" contains 38 symbols for the ConceptDraw PRO diagramming and vector drawing software.
"... classes are represented with boxes which contain three parts:
(1) The top part contains the name of the class. It is printed in Bold, centered and the first letter capitalized.
(2) The middle part contains the attributes of the class. They are left aligned and the first letter is lower case.
(3) The bottom part gives the methods or operations the class can take or undertake. They are also left aligned and the first letter is lower case. ...
To indicate a classifier scope for a member, its name must be underlined. ...
An association can be named, and the ends of an association can be adorned with role names, ownership indicators, multiplicity, visibility, and other properties. ...
Aggregation ... is graphically represented as a hollow diamond shape on the containing class end of the tree with a single line that connects the contained class to the containing class.
... graphical representation of a composition relationship is a filled diamond shape on the containing class end of the tree of lines that connect contained class(es) to the containing class.
... graphical representation of a Generalization is a hollow triangle shape on the superclass end of the line (or tree of lines) that connects it to one or more subtypes.
... graphical representation of a Realization is a hollow triangle shape on the interface end of the dashed line (or tree of lines) that connects it to one or more implementers. A plain arrow head is used on the interface end of the dashed line that connects it to its users.
Multiplicity ... representation of an association is a line with an optional arrowhead indicating the role of the object(s) in the relationship, and an optional notation at each end indicating the multiplicity of instances of that entity (the number of objects that participate in the association).
Entity classes ... are drawn as circles with a short line attached to the bottom of the circle. Alternatively, they can be drawn as normal classes with the «entity» stereotype notation above the class name." [Class diagram. Wikipedia]
The example "Design elements - UML class diagrams" is included in the Rapid UML solution from the Software Development area of ConceptDraw Solution Park.
UML class diagram symbols
The vector stencils library "Plane geometry" contains 27 plane geometric figures.
Use these shapes to draw your geometrical diagrams and illustrations in the ConceptDraw PRO diagramming and vector drawing software extended with the Mathematics solution from the Science and Education area of ConceptDraw Solution Park.
Use these shapes to draw your geometrical diagrams and illustrations in the ConceptDraw PRO diagramming and vector drawing software extended with the Mathematics solution from the Science and Education area of ConceptDraw Solution Park.
Circular sector
Right triangle
Rectangle
Square
Pentagon
Isosceles trapezium
Parallelogram
Trapezium
Three-pointed star
Four-pointed star
Five-pointed star
Six-pointed star
Seven-pointed star
Eight-pointed star
Triangle
Equilateral triangle
Right triangle 2
Right triangle, angle box
Right triangle 3
Hexagon
Regular hexagon
Regular pentagon
Regular heptagon
Regular octagon
Rhombus
Circle
Ellipse
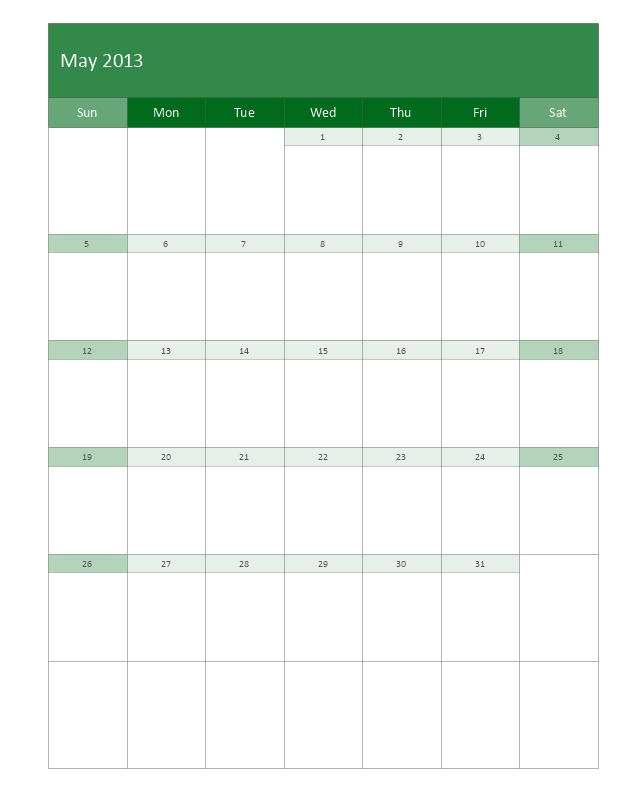
The vector stencils library "Calendars" contains 44 shapes of month calendars, marker icons and symbols for schedules, and clocks. Use it to create your calendars in the ConceptDraw PRO diagramming and vector drawing software extended with the Calendars solution from the Management area of ConceptDraw Solution Park.
Small Calendar (White, Rounded)
-calendars---vector-stencils-library.png--diagram-flowchart-example.png)
Small Calendar (White)
-calendars---vector-stencils-library.png--diagram-flowchart-example.png)
Small Calendar (Black, Rounded)
-calendars---vector-stencils-library.png--diagram-flowchart-example.png)
Small Calendar (Black)
-calendars---vector-stencils-library.png--diagram-flowchart-example.png)
Small Calendar (Color, Rounded)
-calendars---vector-stencils-library.png--diagram-flowchart-example.png)
Small Calendar (Color)
-calendars---vector-stencils-library.png--diagram-flowchart-example.png)
Mid Calendar (Rounded)
-calendars---vector-stencils-library.png--diagram-flowchart-example.png)
Mid Calendar
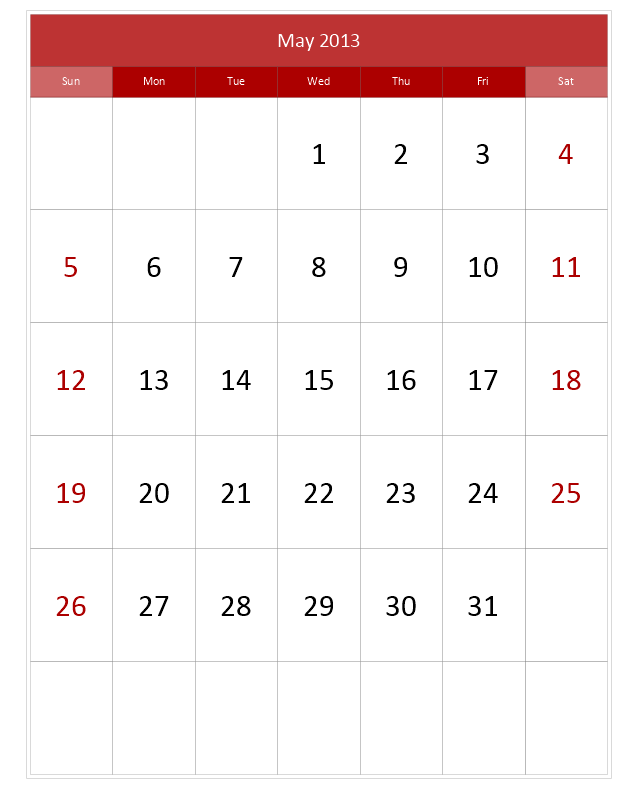
Large Calendar (Picture 1)
-calendars---vector-stencils-library.png--diagram-flowchart-example.png)
Large Calendar (Picture 2)
-calendars---vector-stencils-library.png--diagram-flowchart-example.png)
Large Calendar (Color)
-calendars---vector-stencils-library.png--diagram-flowchart-example.png)
Large Calendar
Large Calendar (Rounded)
-calendars---vector-stencils-library.png--diagram-flowchart-example.png)
Stylish Clocks

Clocks

Clocks

Week (First Letters)
-calendars---vector-stencils-library.png--diagram-flowchart-example.png)
Week
7 days
7 days
Month

Weeks
Quarter
3 Month
Special Day (Circle)
-calendars---vector-stencils-library.png--diagram-flowchart-example.png)
Special Day (Square)
-calendars---vector-stencils-library.png--diagram-flowchart-example.png)
Special Day (Triangle)
-calendars---vector-stencils-library.png--diagram-flowchart-example.png)
Special Day (Star)
-calendars---vector-stencils-library.png--diagram-flowchart-example.png)
Special Day (Cross)
-calendars---vector-stencils-library.png--diagram-flowchart-example.png)
Special Day (Check)
-calendars---vector-stencils-library.png--diagram-flowchart-example.png)
Special Day (Clocks)
-calendars---vector-stencils-library.png--diagram-flowchart-example.png)
Special Day (Note)
-calendars---vector-stencils-library.png--diagram-flowchart-example.png)
Special Day (Lightning)
-calendars---vector-stencils-library.png--diagram-flowchart-example.png)
Special Day (Heart)
-calendars---vector-stencils-library.png--diagram-flowchart-example.png)
:)
-calendars---vector-stencils-library.png--diagram-flowchart-example.png)
:(

Moon phase, new
Moon phase, waxing crescent
Moon phase, 1st quarter
Moon phase, waxing gibbous
Moon phase, full
Moon phase, waning gibbous
Moon phase, 3rd quarter
Moon phase, waning crescent
- Money Circle Png
- Pentagon Png
- Octagon White Png
- Plane geometry - Vector stencils library | Geometric Triangle Png
- Triangle Png Vector
- White Hexagon Shape Png
- Marker Png Number
- Research cycle - Circle diagram | Export from ConceptDraw PRO ...
- Pyramid Diagram | Time, quality, money triangle diagram | Pyramid ...
- Vicious circle - Crystal diagram | Geo Map - Europe - France ...
- Octagon Png
- Hexagonal Png Vector
- Hexagon Png
- Organizational culture - Triangle diagram | Pyramid Diagram | Matrix ...
- Plane geometry - Vector stencils library | Geometric Pentagons Png
- End Line Png
- Circle For Numbers Vector Png
- Circle White Png
- Physics Diagrams | Research cycle - Circle diagram | LLNL Flow ...
- Search Icon Png In Circle