 Telecommunication Network Diagrams
Telecommunication Network Diagrams solution extends ConceptDraw PRO software with samples, templates, and great collection of vector stencils to help the specialists in a field of networks and telecommunications, as well as other users to create Computer systems networking and Telecommunication network diagrams for various fields, to organize the work of call centers, to design the GPRS networks and GPS navigational systems, mobile, satellite and hybrid communication networks, to construct the mobile TV networks and wireless broadband networks.
Pie Chart Software
A pie chart is a circular diagram showing a set of data divided into proportional slices. There are several variations of this chart such as donut chart, exploded pie chart, multi-level pie charts. Although it is not very informative when a ring chart or circle chart has many sections, so choosing a low number of data points is quite important for a useful pie chart. ConceptDraw PRO software with Pie Charts solution helps to create pie and donut charts for effective displaying proportions in statistics, business and mass media for composition comparison, i.e. for visualization of part percentage inside one total.Chart Maker for Presentations
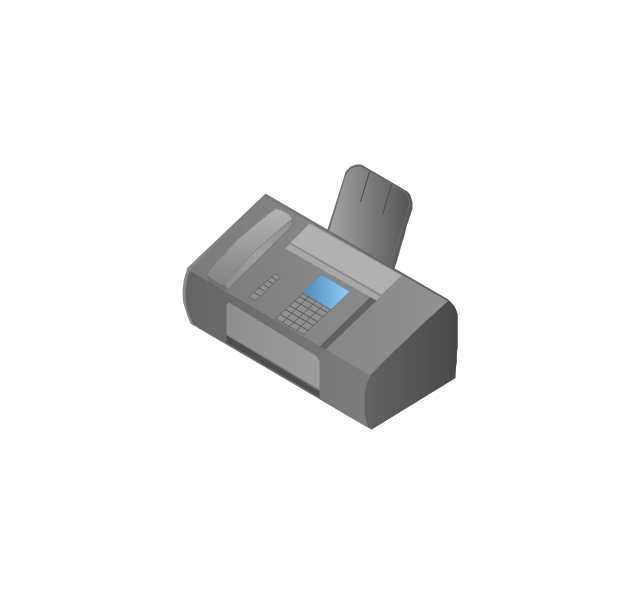
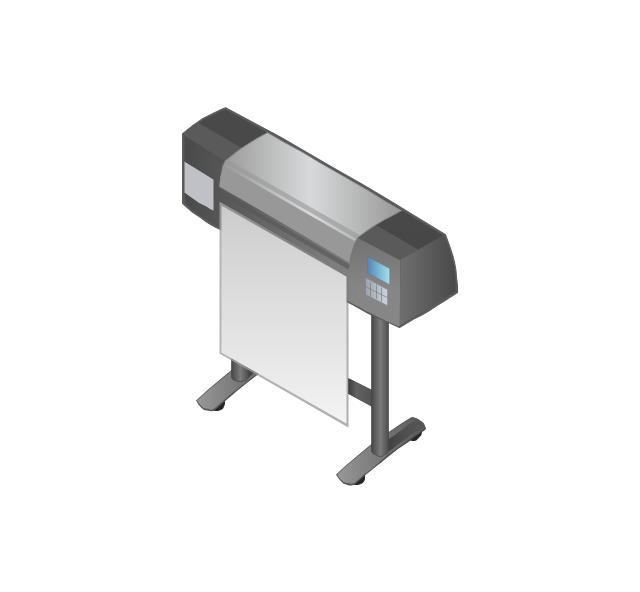
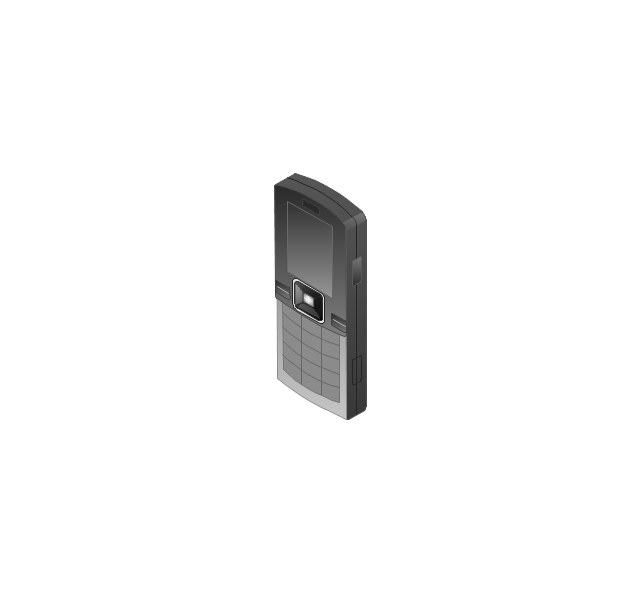
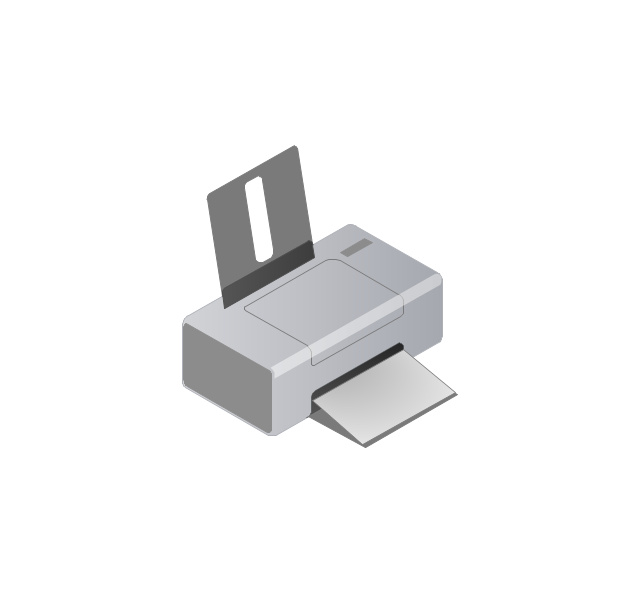
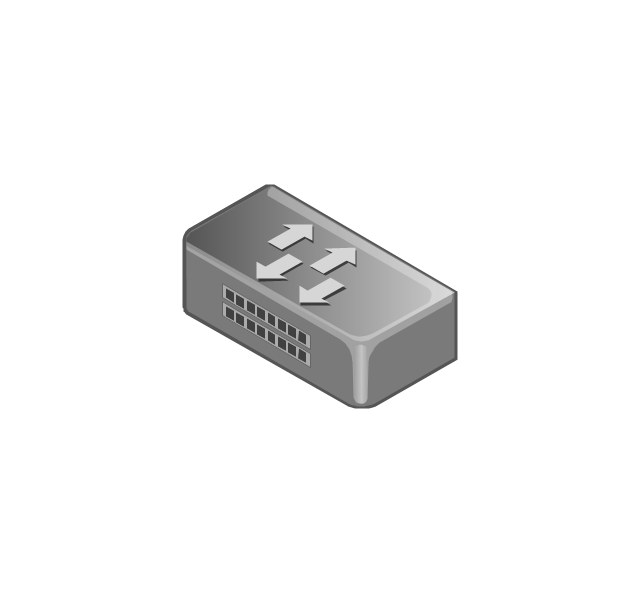
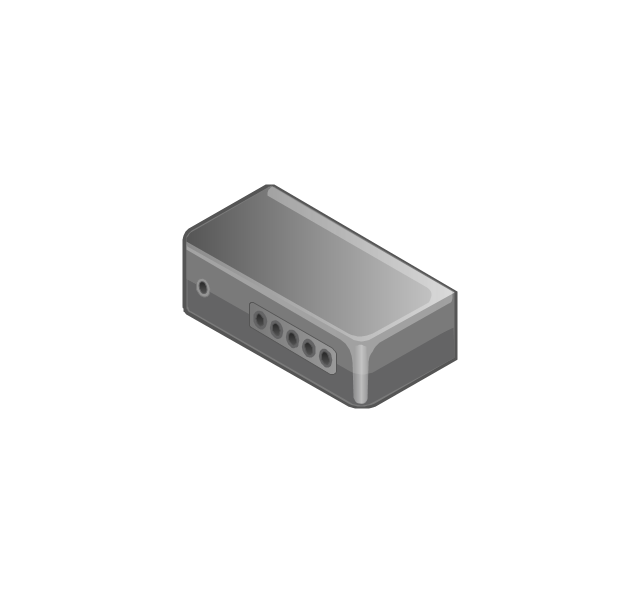
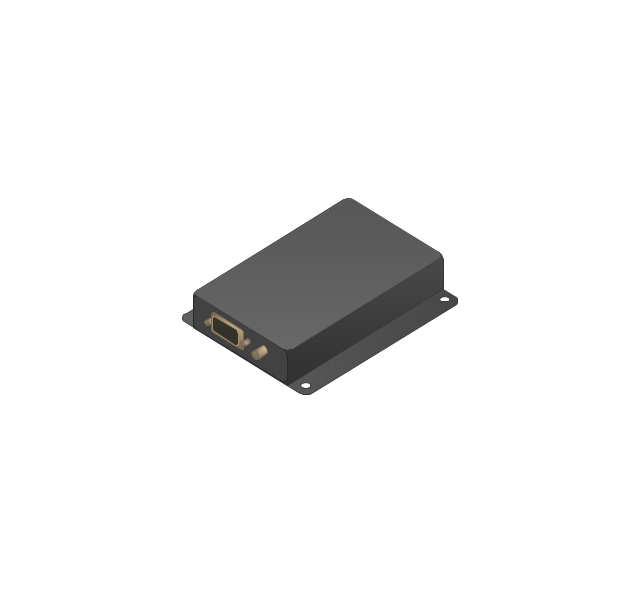
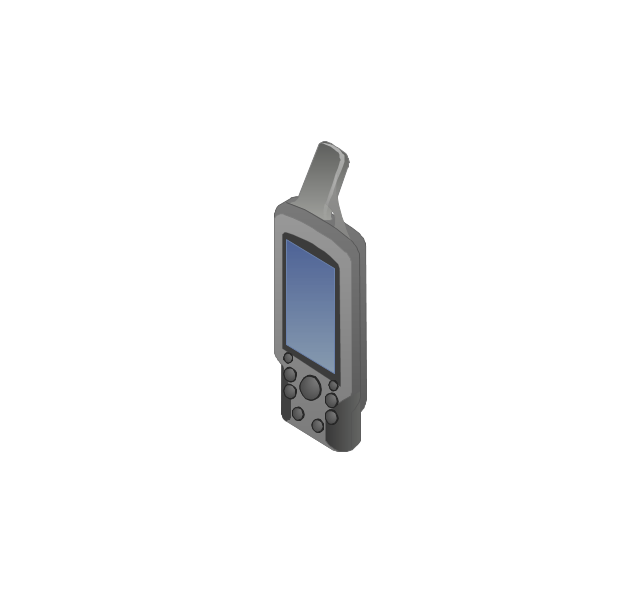
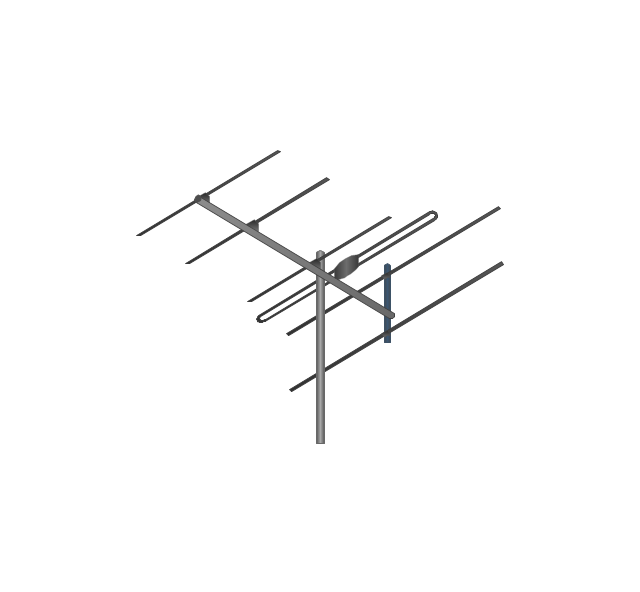
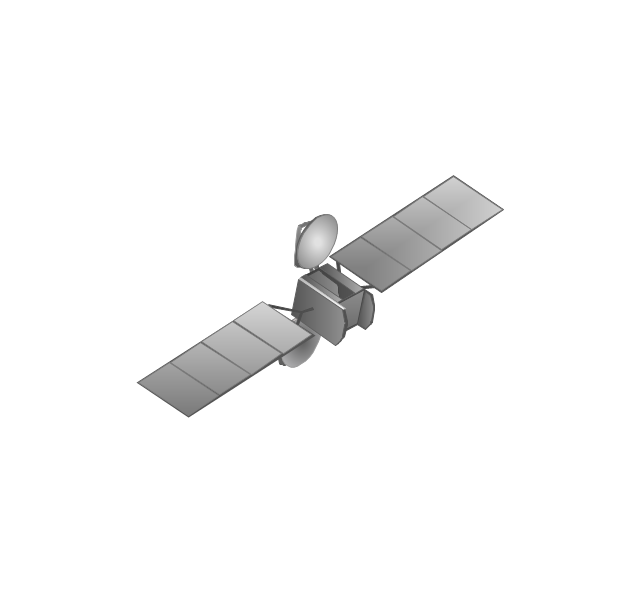
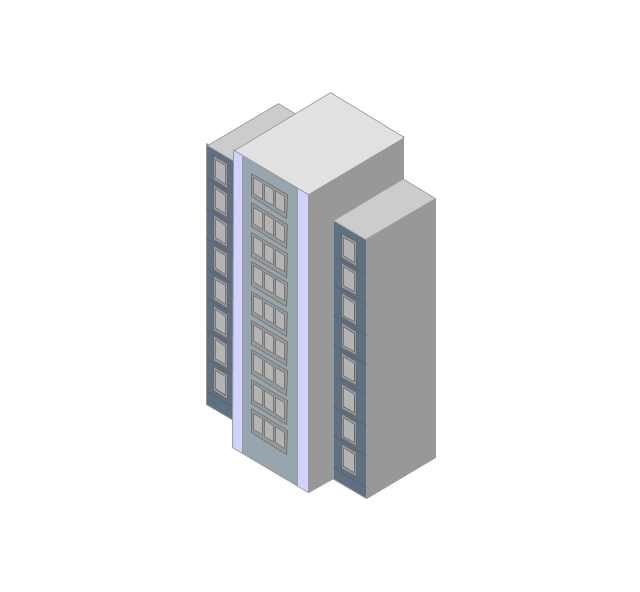
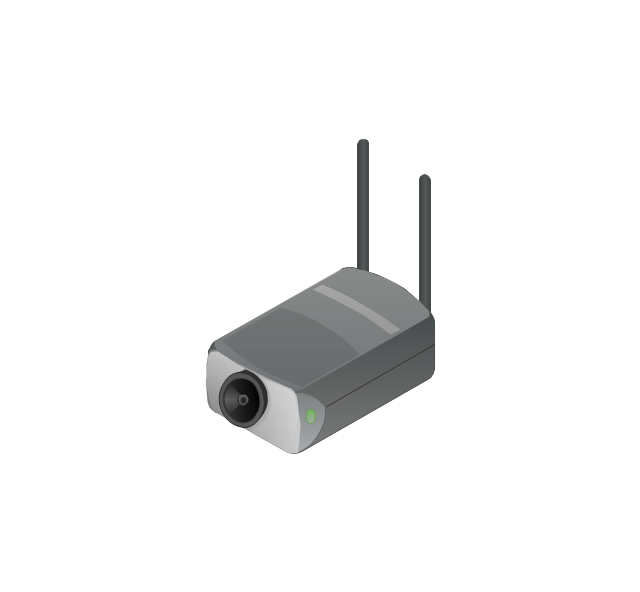
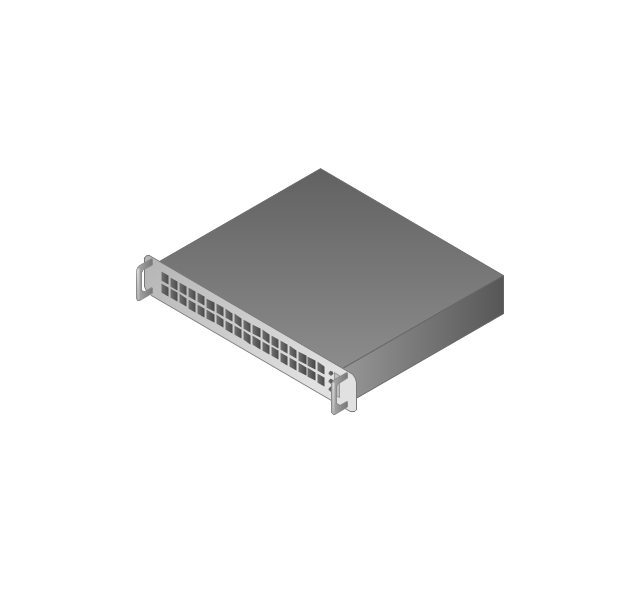
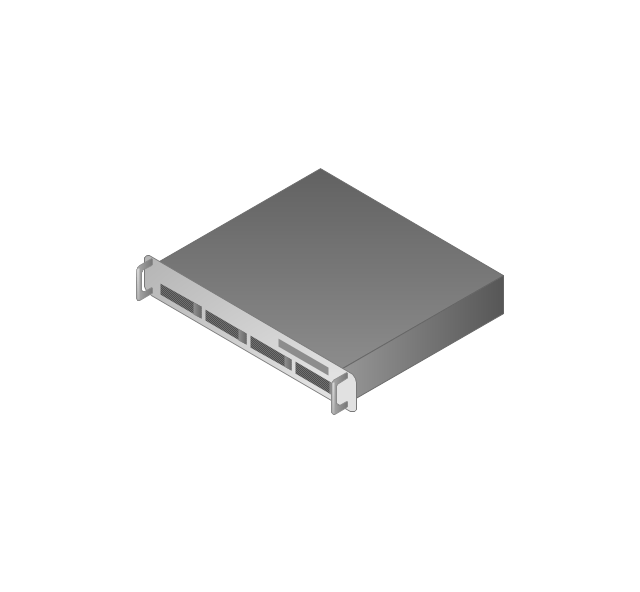
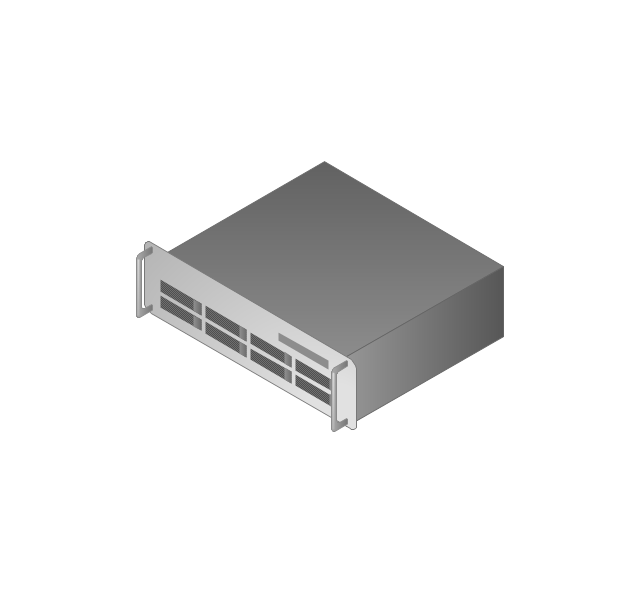
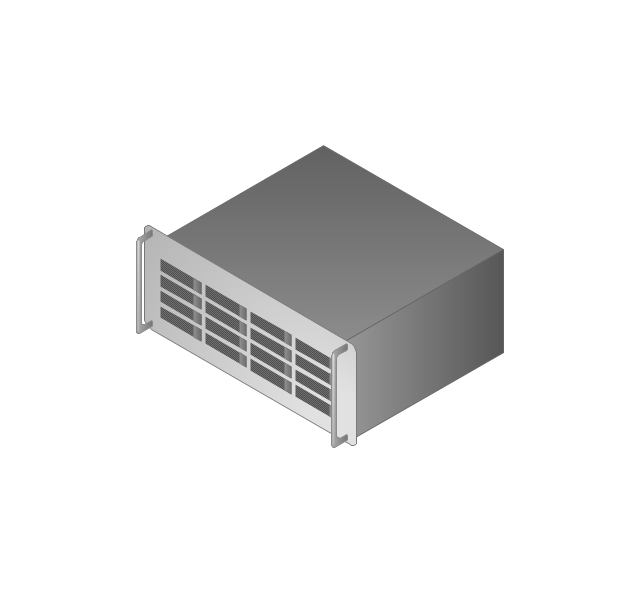
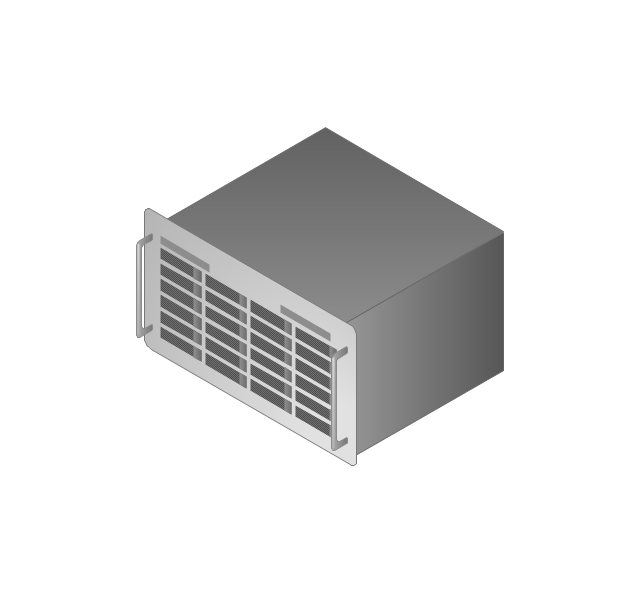
Easy charting software comes with beautiful chart templates and examples. This makes it easy to create professional charts without prior experience.The vector stencils library "Computers and network isometric" contains 56 3D clipart images of computer and network devices and equipment for drawing network diagrams.
The clip art example "Computers and network isometric - Vector stencils library" was created using the ConceptDraw PRO diagramming and vector drawing software extended with the Computer and Networks solution from the Computer and Networks area of ConceptDraw Solution Park.
The clip art example "Computers and network isometric - Vector stencils library" was created using the ConceptDraw PRO diagramming and vector drawing software extended with the Computer and Networks solution from the Computer and Networks area of ConceptDraw Solution Park.
The vector stencils library "Audio" contains 91 audio, sound and music icons. Use it to design your audio, video and multimedia illustrations, presentations, web pages and infographics with ConceptDraw PRO diagramming and vector drawing software.
"Digital audio refers to technology that can be used to record, store, generate, manipulate, and reproduce sound using audio signals encoded in digital form. Following significant advances in digital audio technology during the 1970s, it rapidly replaced analog audio technology in most areas of sound production, sound engineering and telecommunications. Sound is converted to an analog electrical signal by a microphone, then an analog-to-digital converter (ADC), typically using pulse-code modulation, is used to convert it to a digital signal. A digital-to-analog converter performs the reverse process, converting a digital signal back into an analog signal, which can be converted to an audible sound by a loudspeaker. Digital audio systems may include compression, storage, processing and transmission components. Conversion to a digital format allows convenient manipulation, storage, transmission and retrieval of an audio signal." [Digital audio. Wikipedia]
The vector stencils library "Audio" is included in the Audio, Video, Media solution from the Illustration area of ConceptDraw Solution Park.
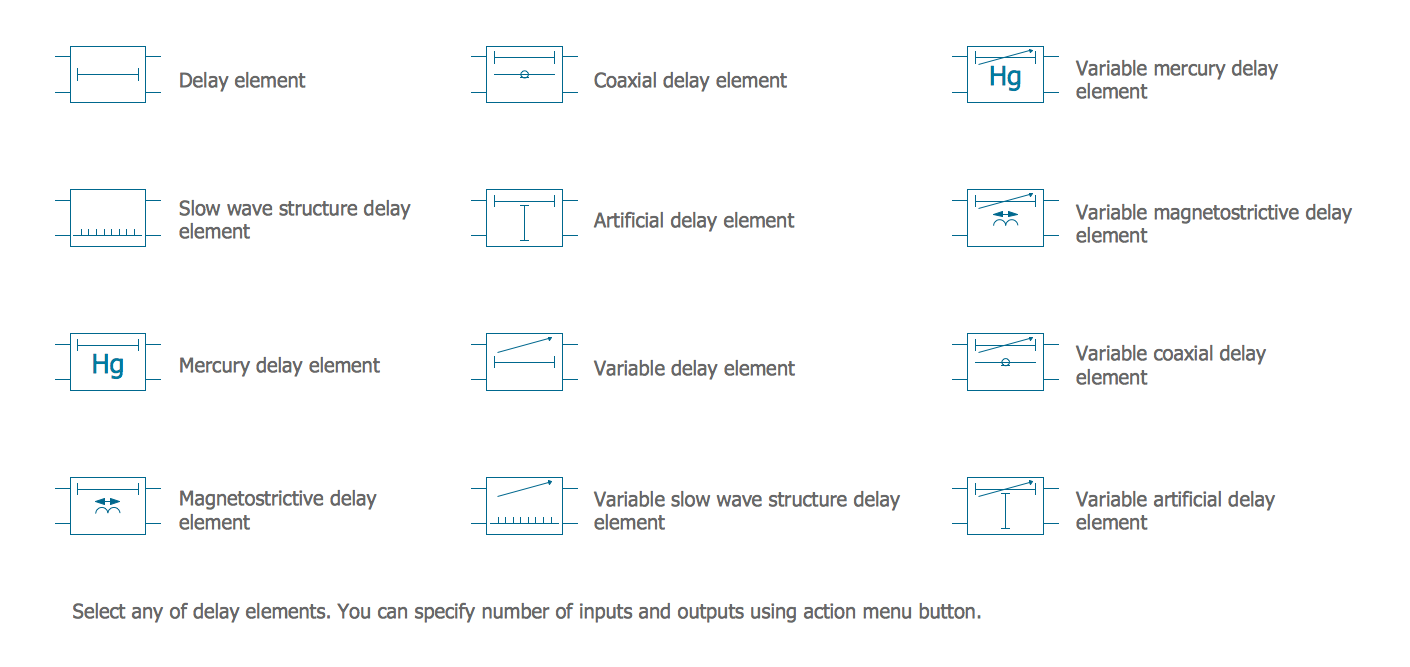
Electrical Symbols — Delay Elements
Variable delay elements are often used to manipulate the rising or falling edges of the clock or any other signal in integrated circuits. Delay elements are also used in delay locked loops and in defining a time reference for the movement of data within those systems. 26 libraries of the Electrical Engineering Solution of ConceptDraw PRO make your electrical diagramming simple, efficient, and effective. You can simply and quickly drop the ready-to-use objects from libraries into your document to create the electrical diagram.
 Line Graphs
How to draw a Line Graph with ease? The Line Graphs solution extends the capabilities of ConceptDraw PRO v10 with professionally designed templates, samples, and a library of vector stencils for drawing perfect Line Graphs.
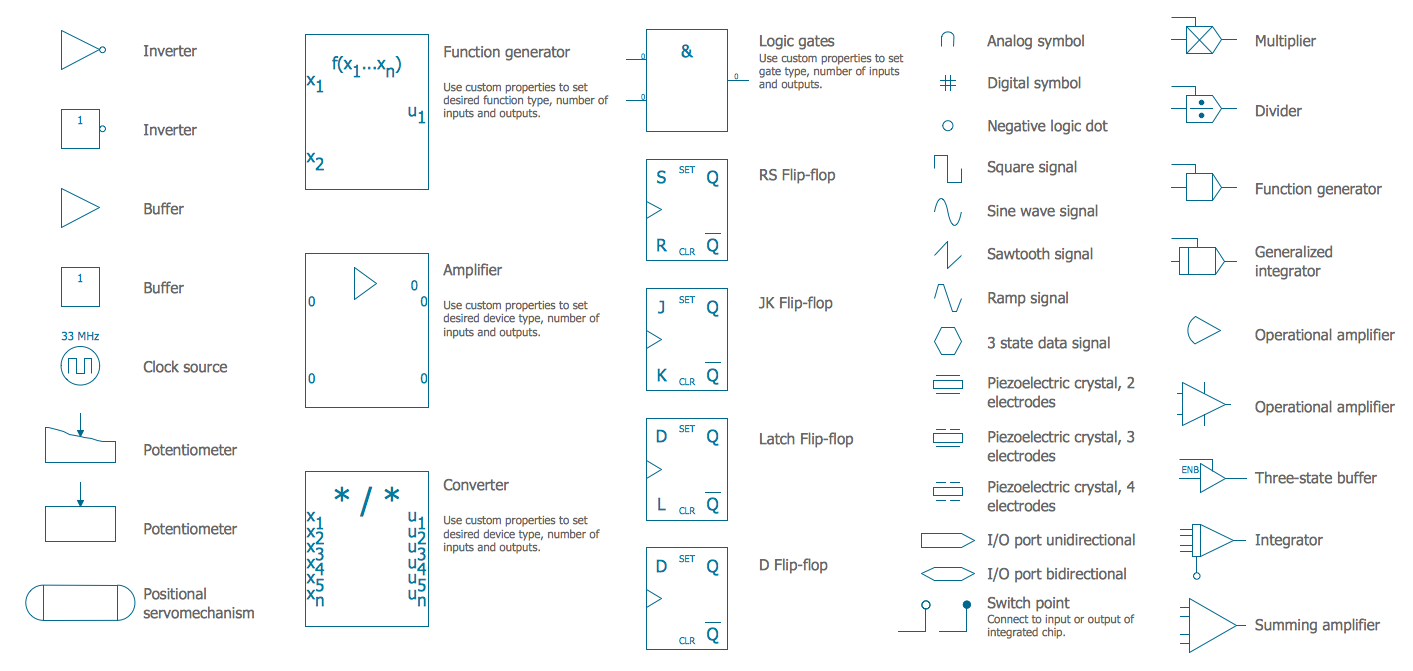
Electrical Symbols — Analog and Digital Logic
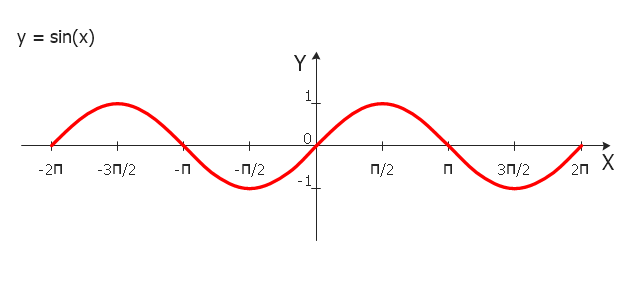
Digital electronics or digital (electronic) circuits are electronics that handle digital signals – discrete bands of analog levels – rather than by continuous ranges (as used in analogue electronics). All levels within a band of values represent the same numeric value. Because of this discretization, relatively small changes to the analog signal levels due to manufacturing tolerance, signal attenuation or parasitic noise do not leave the discrete envelope, and as a result are ignored by signal state sensing circuitry. 26 libraries of the Electrical Engineering Solution of ConceptDraw PRO make your electrical diagramming simple, efficient, and effective. You can simply and quickly drop the ready-to-use objects from libraries into your document to create the electrical diagram."In mathematics, the sine function is a trigonometric function of an angle. The sine of an angle is defined in the context of a right triangle: for the specified angle, it is the ratio of the length of the side that is opposite that angle to (divided by) the length of the longest side of the triangle (i.e. the hypotenuse).
Trigonometric functions are commonly defined as ratios of two sides of a right triangle containing the angle, and can equivalently be defined as the lengths of various line segments from a unit circle. More modern definitions express them as infinite series or as solutions of certain differential equations, allowing their extension to arbitrary positive and negative values and even to complex numbers.
The sine function is commonly used to model periodic phenomena such as sound and light waves, the position and velocity of harmonic oscillators, sunlight intensity and day length, and average temperature variations throughout the year." [Sine. Wikipedia]
The trigonometric function graph example "Sine function" was created using the ConceptDraw PRO diagramming and vector drawing software extended with the Mathematics solution from the Science and Education area of ConceptDraw Solution Park.
Flow chart Example. Warehouse Flowchart
Warehouse Flowcharts are various diagrams that describe the warehousing and inventory management processes on the warehouses. Typical purposes of Warehouse Flowcharts are evaluating warehouse performance, measuring efficiency of customer service and organizational performance. This type of Workflow diagrams can be used for identifying any disconnection between business activities and business objectives. They are effectively used by warehouse-related people and organizations, manufacturers, wholesalers, exporters, importers, transporters, and others. Standard Warehousing process flow diagram and standard Workflow diagram are used for process identification for further evaluating effectiveness and profitability of overall business process. Use the ConceptDraw PRO vector graphic software extended with Flowcharts solution to design your own professional-looking Workflow diagrams and Flowcharts of any types, including the Warehouse flowchart, Process flow diagrams which depict in details all steps of Warehouse packages flow. Microsoft Visio, designed for Windows users, can’t be opened directly on Mac. But fortunately, there are several Visio alternatives for Mac which will help Mac users to work Visio files. With ConceptDraw PRO, you may open, edit and save files in Visio format.
 Wireless Networks
The Wireless Networks Solution extends ConceptDraw PRO software with professional diagramming tools, set of wireless network diagram templates and samples, comprehensive library of wireless communications and WLAN objects to help network engineers and designers efficiently design and create Wireless network diagrams that illustrate wireless networks of any speed and complexity, and help to identify all required equipment for construction and updating wireless networks, and calculating their costs.
Chart Templates
Easy charting software comes with beautiful chart templates and examples. This makes it easy to create professional charts without prior experience.
 Basic Line Graphs
This solution extends the capabilities of ConceptDraw PRO v10.3.0 (or later) with templates, samples and a library of vector stencils for drawing Line Graphs.
- Circular Waves
- Waves Circle Png
- Sound Waves Png
- How To use House Electrical Plan Software | Target and Circular ...
- Circle Laptop Png
- Emergency management process | Fire and Emergency Plans ...
- Circle 4 Phases Png
- Near-me area networks (NAN). Computer and Network Examples ...
- Phone Logo Png Circle
- Wireless broadband network diagram | Infographic Generator | One ...
- Personal area (PAN) networks. Computer and Network Examples ...
- Research cycle - Circle diagram | Research onion diagram ...
- Construction Project Chart Examples | Process Flowchart | 3 Circle ...
- Venn Diagram Template for Word | 3 Circle Venn. Venn Diagram ...
- Best Multi-Platform Diagram Software | Near-me area networks ...
- Flow chart Example. Warehouse Flowchart | Wave Energy Creation ...
- Base Station Radio Waves Png
- Mathematical Diagrams | Basic Flowchart Symbols and Meaning | 3 ...
- Conceptdraw.com: Mind Map Software, Drawing Tools | Project ...
- Vector Logo For Circle Png


