"In telecommunications systems, trunking is the aggregation of multiple user circuits into a single channel. The aggregation is achieved using some form of multiplexing. Trunking theory was developed by Agner Krarup Erlang, Erlang based his studies of the statistical nature of the arrival and the length of calls. The Erlang B formula allows for the calculation of the number of circuits required in a trunk based on the Grade of Service and the amount of traffic in Erlangs the trunk needs cater for. ...
In order to provide connectivity between all users on the network one solution is to build a full mesh network between all endpoints. A full mesh solution is however impractical, a far better approach is to provide a pool of resources that end points can make use of in order to connect to foreign exchanges. ...
The Danish mathematician Agner Krarup Erlang is the founder of teletraffic engineering. Erlang developed the fundamentals of trunking theory while investigating how a large population can be serviced by a limited number of servers. Trunking theory leverages off the statistical behaviour of users accessing the network, these characteristics discussed in the assumptions of the Erlang B equation." [Teletraffic engineering/ Trunking. Wikiversity]
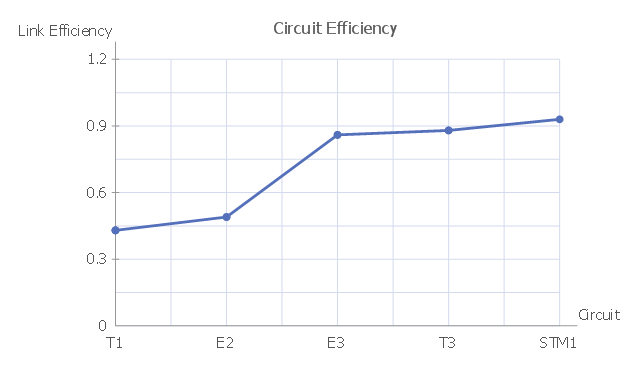
The line chart example "Circuit efficiency for telecommunications" was redesigned from the Wikimedia Commons file: Circuit efficiency Erlang B.png [commons.wikimedia.org/ wiki/ File:Circuit_ efficiency_ Erlang_ B.png].
This file is licensed under the Creative Commons Attribution-Share Alike 3.0 Unported license.
[creativecommons.org/ licenses/ by-sa/ 3.0/ deed.en]
The line chart example "Circuit efficiency for telecommunications" was created using the ConceptDraw PRO diagramming and vector drawing software extended with the Line Graphs solution from the Graphs and Charts area of ConceptDraw Solution Park.
In order to provide connectivity between all users on the network one solution is to build a full mesh network between all endpoints. A full mesh solution is however impractical, a far better approach is to provide a pool of resources that end points can make use of in order to connect to foreign exchanges. ...
The Danish mathematician Agner Krarup Erlang is the founder of teletraffic engineering. Erlang developed the fundamentals of trunking theory while investigating how a large population can be serviced by a limited number of servers. Trunking theory leverages off the statistical behaviour of users accessing the network, these characteristics discussed in the assumptions of the Erlang B equation." [Teletraffic engineering/ Trunking. Wikiversity]
The line chart example "Circuit efficiency for telecommunications" was redesigned from the Wikimedia Commons file: Circuit efficiency Erlang B.png [commons.wikimedia.org/ wiki/ File:Circuit_ efficiency_ Erlang_ B.png].
This file is licensed under the Creative Commons Attribution-Share Alike 3.0 Unported license.
[creativecommons.org/ licenses/ by-sa/ 3.0/ deed.en]
The line chart example "Circuit efficiency for telecommunications" was created using the ConceptDraw PRO diagramming and vector drawing software extended with the Line Graphs solution from the Graphs and Charts area of ConceptDraw Solution Park.
Line chart
Line Graph Charting Software

 Line Graphs
How to draw a Line Graph with ease? The Line Graphs solution extends the capabilities of ConceptDraw PRO v10 with professionally designed templates, samples, and a library of vector stencils for drawing perfect Line Graphs.
Chart Examples

Line Chart Examples

Think. Act. Accomplish.

- Line graph - Circuit efficiency for telecommunications | Design ...
- Line Graph Charting Software | How To Create Restaurant Floor ...
- Line Chart Examples - Conceptdraw.com
- Line Graph Charting Software | Create Graphs and Charts | Chart ...
- Line Graph Charting Software | Bar Chart Software | Column Chart ...
- Line Chart Examples - Conceptdraw.com
- Line Graphs | Line Graph Charting Software | Design elements ...
- Technical Drawing Software | How To use Electrical and Telecom ...
- Line Graph Charting Software | Basic Diagramming | How to Create ...
- Telecommunication Network Diagrams | Design Elements ...
- Line Graph Charting Software
- Picture graph - Population growth by continent, 2010 - 2013 | Line ...
- Circuit diagram - Electron vacuum tubes | Circuit diagram - Electron ...
- Line Graph Charting Software | Line Chart Examples | How to ...
- Technical Drawing Software | Wiring Diagrams with ConceptDraw ...
- Line Graphs
- Chart Examples | Line Chart Examples | Bar Chart Examples |
- Line Graphs | Line Graph Charting Software | Line graph template ...
- Polar Graph | Step Area Graph | Picture graph template |
- Visual Presentations Made Easy with Diagramming Software | Basic ...