Technical Drawing Software
Technical drawing or draft is a form of specialized graphic communication, exchange of ideas in industry and engineering. It is a visual representation of object with indication of dimensions and used material, constructed with maintaining the proportions between its parts. Technical drawings are constructed by architects, technologists, engineers, designers, drafters, and other technical professionals according to defined rules, specifications, internationally accepted standards and standardized notations allowing to make unambiguous, clear and understandable technical drawings. ConceptDraw DIAGRAM extended with Electrical Engineering solution, Mechanical Engineering solution, Chemical and Process Engineering solution from Industrial Engineering Area of ConceptDraw Solution Park is ideal technical drawing software. Its powerful drawing tools, predesigned vector objects, templates, samples are helpful for creation all kinds of Technical Drawings and Technical Diagrams, Electrical and Mechanical Schematics, Circuit and Wiring Diagrams, Structural Drawings, and many other.Hotel Network Topology Diagram
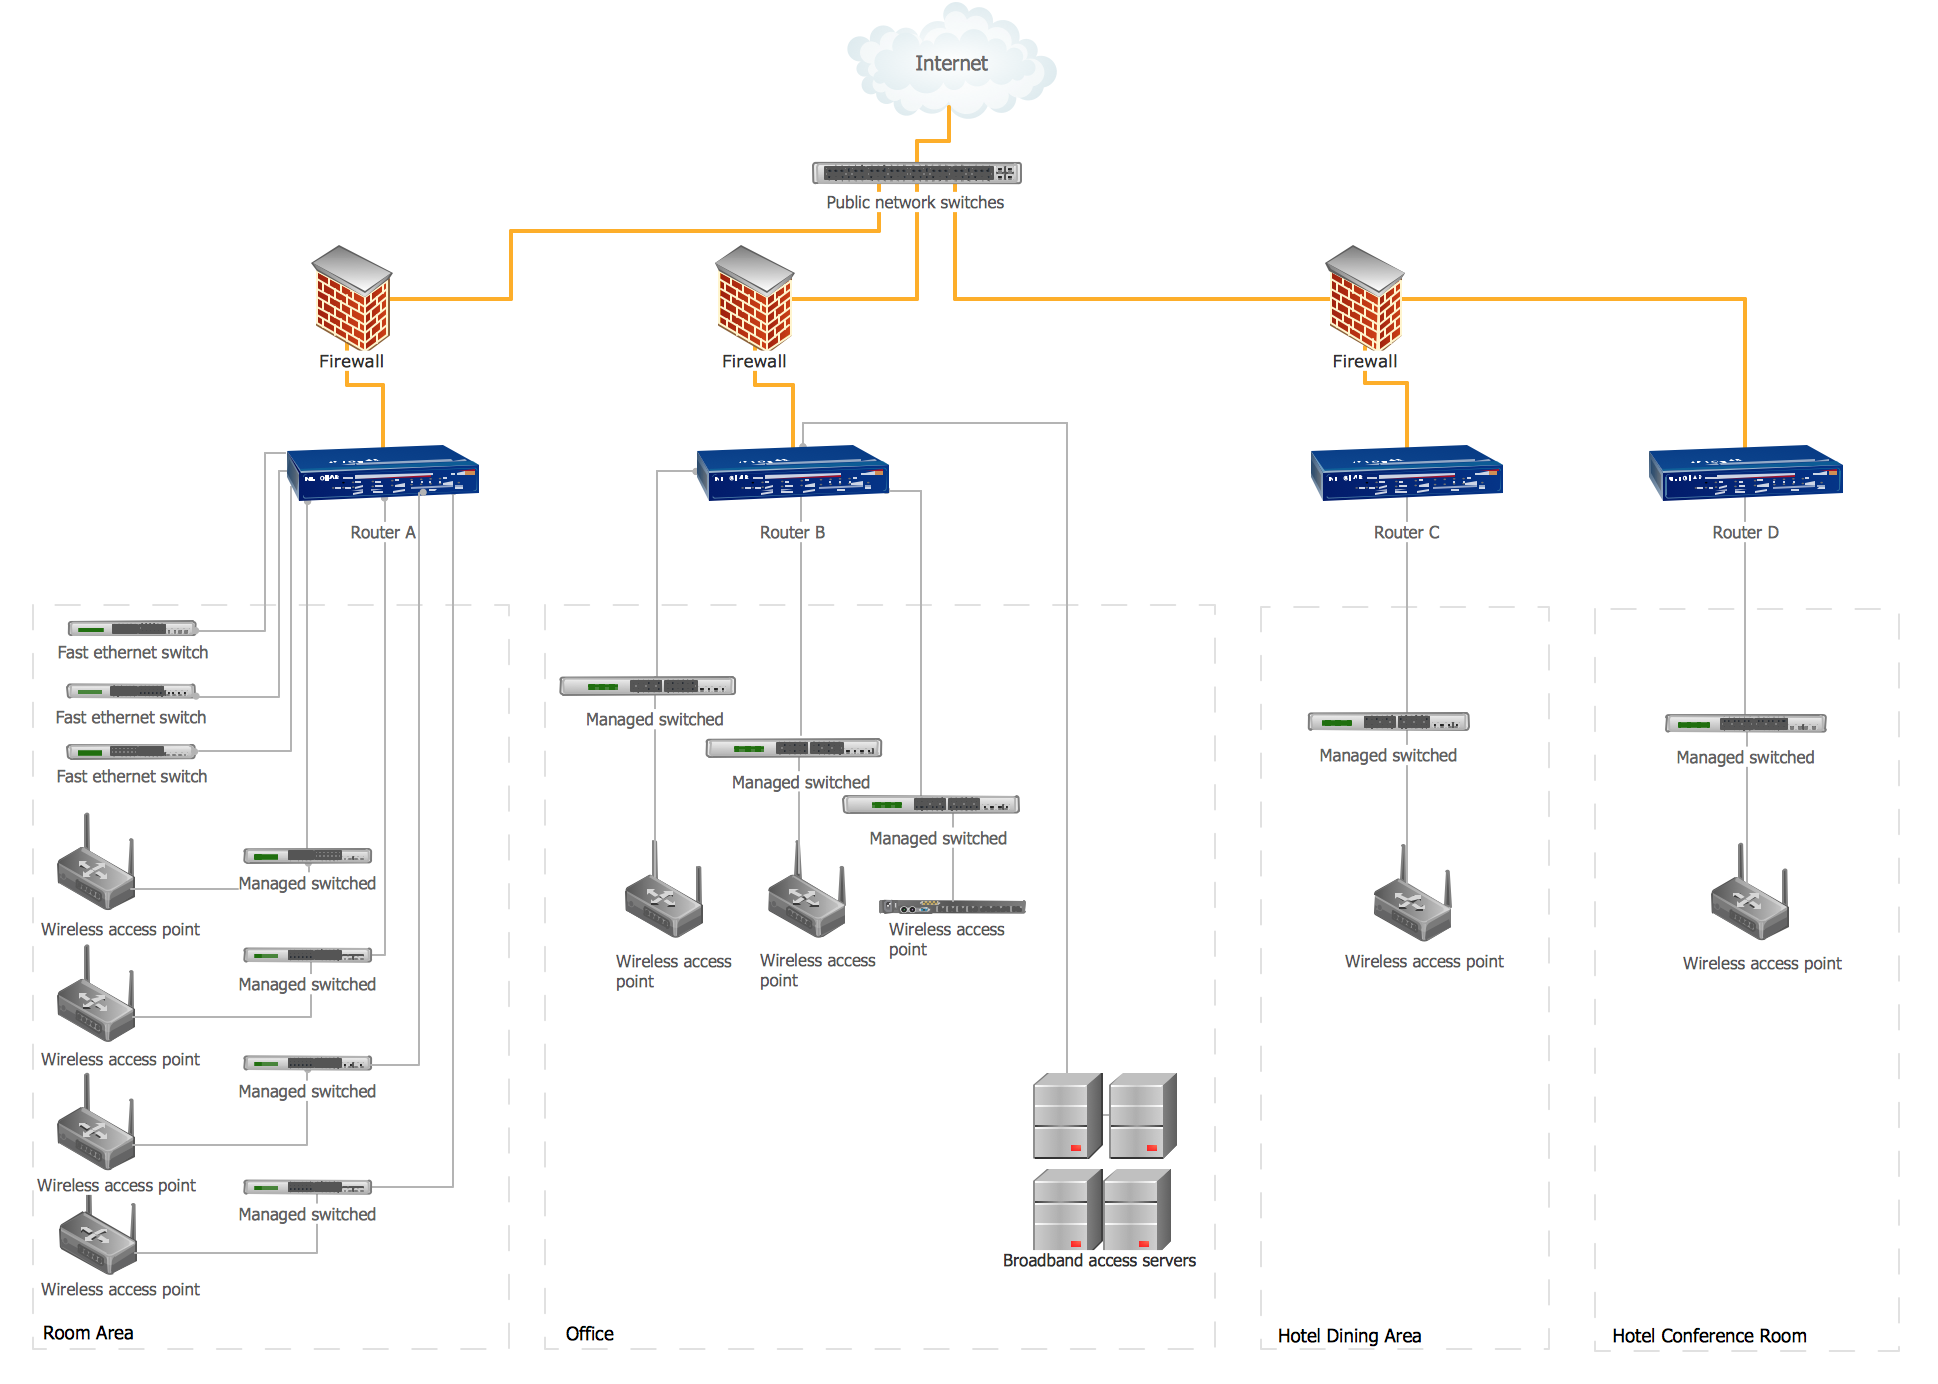
Network topology is a layout of various elements of computer network, such as nodes, links, routers, etc. It is a network topological structure which can be depicted logically or physically. Physical topology shows the physical location of network's components and cable connections between network nodes. Logical topology describes the data flows, the circulation of signals in physical topology. The physical and logical topologies for two networks can be identical, while their physical interconnections, the distances between nodes, transmission rates, and/or signal types may be differ. ConceptDraw DIAGRAM with Computer and Networks solution from Computer and Networks area of ConceptDraw Solution Park lets you design physical and logical network topology diagrams for wireless and wired computer communication networks located in various premises, including the hotels. You can easy design Hotel Network Topology Diagram, diagrams depicted LANs and WLANs, and also any of eight basic topologies (Point-to-point, Star, Bus, Mesh, Ring, Tree, Hybrid, Daisy chain).
Gane Sarson Diagram
The Gane-Sarson methodology uses the graphical techniques for building the logical models for the systems. It is helpful for analysts and designers to make common and clear picture of the system, to depict all its processes and how they transform the data. The Gane-Sarson methodology lets represent all this information in a way understandable for the users and other interested people, and gives the possibility to see instantly how the system's parts serve together to meet their needs. This methodology supposes the building of a system top-down. First you need create an overall system data flow, then determine the details of the data structures, the process logic and design the modular structures. ConceptDraw DIAGRAM diagramming and vector drawing software offers the Data Flow Diagrams solution with Gane-Sarson Notation library rich for the specific symbols of the Gane-Sarson notation. All they are vector and fully ready-to-use for drawing the Data Flow Diagrams, which will be then successfully used in presentations, websites, and various business documents.S Video Connection
S-Video is a signaling standard for standard definition video. ConceptDraw DIAGRAM diagramming and vector drawing software extended with Audio and Video Connectors Solution from the Industrial Engineering Area can be helpful for demostrating and explaining the S Video connection which is widely used on TVs and home theater receivers.
 Entity-Relationship Diagram (ERD)
An Entity-Relationship Diagram (ERD) is a visual presentation of entities and relationships. That type of diagrams is often used in the semi-structured or unstructured data in databases and information systems. At first glance ERD is similar to a flowch
 Network Security Diagrams
The Network Security Diagrams solution presents a large collection of predesigned cybersecurity vector stencils, cliparts, shapes, icons and connectors to help you succeed in designing professional and accurate Network Security Diagrams, Network Security Infographics to share knowledge about effective ways of networks protection with help of software and network security devices of different cyber security degrees, Network Plans for secure wireless network, Computer Security Diagrams to visually tell about amazing possibilities of IT security solutions. The samples and examples reflect the power of ConceptDraw DIAGRAM software in drawing Network Security Diagrams, give the representation about variety of existing types of attacks and threats, help to realize their seriousness and the methods to deal with them.
Pie Chart Examples and Templates
A pie chart or a circle graph is a circular chart divided into sectors, illustrating numerical proportion. In a pie chart, the arc length of each sector and consequently its central angle and area, is proportional to the quantity it represents. Pie chart examples and templates created using ConceptDraw DIAGRAM software helps you get closer with pie charts and find pie chart examples suite your needs.- Cafe electrical floor plan | Restaurant Floor Plan | How To Create ...
- How to Draw a Process Flow Diagram in ConceptDraw PRO
- Circuits and Logic Diagram Software | Technical Drawing Software ...
- Design elements - Bank UML profile diagram | HVAC control ...
- How to Draw a Chemical Process Flow Diagram | Chemical and ...
- How to Create an Electrical Diagram Using ConceptDraw PRO ...
- Process Flow Diagram Symbols | Chemical Engineering | Technical ...
- Process Engineering | Chemical and Process Engineering | Process ...
- Process Flow Diagram Symbols
- Electrical Symbols , Electrical Diagram Symbols | Electrical ...
- Process Flow Diagram Symbols | Chemical Engineering | Technical ...
- How To use House Electrical Plan Software | Cisco Network ...
- Process Flow Diagram Symbols | Chemical Engineering | How to ...
- How to Draw a Chemical Process Flow Diagram | Design elements ...
- How to Add a Block Diagram to a PowerPoint Presentation | How to ...
- Single Line Diagram Of Hvac Water Cooler System
- Electrical Symbols , Electrical Diagram Symbols | Mechanical ...
- Create Organizational Chart | Basic Flowchart Symbols and ...
- Process Flow Diagram Symbols | How to Draw a Chemical Process ...
- Block Diagram Of Line Organization


