 Entity-Relationship Diagram (ERD)
Entity-Relationship Diagram (ERD) solution extends ConceptDraw PRO software with templates, samples and libraries of vector stencils from drawing the ER-diagrams by Chen's and crow’s foot notations.
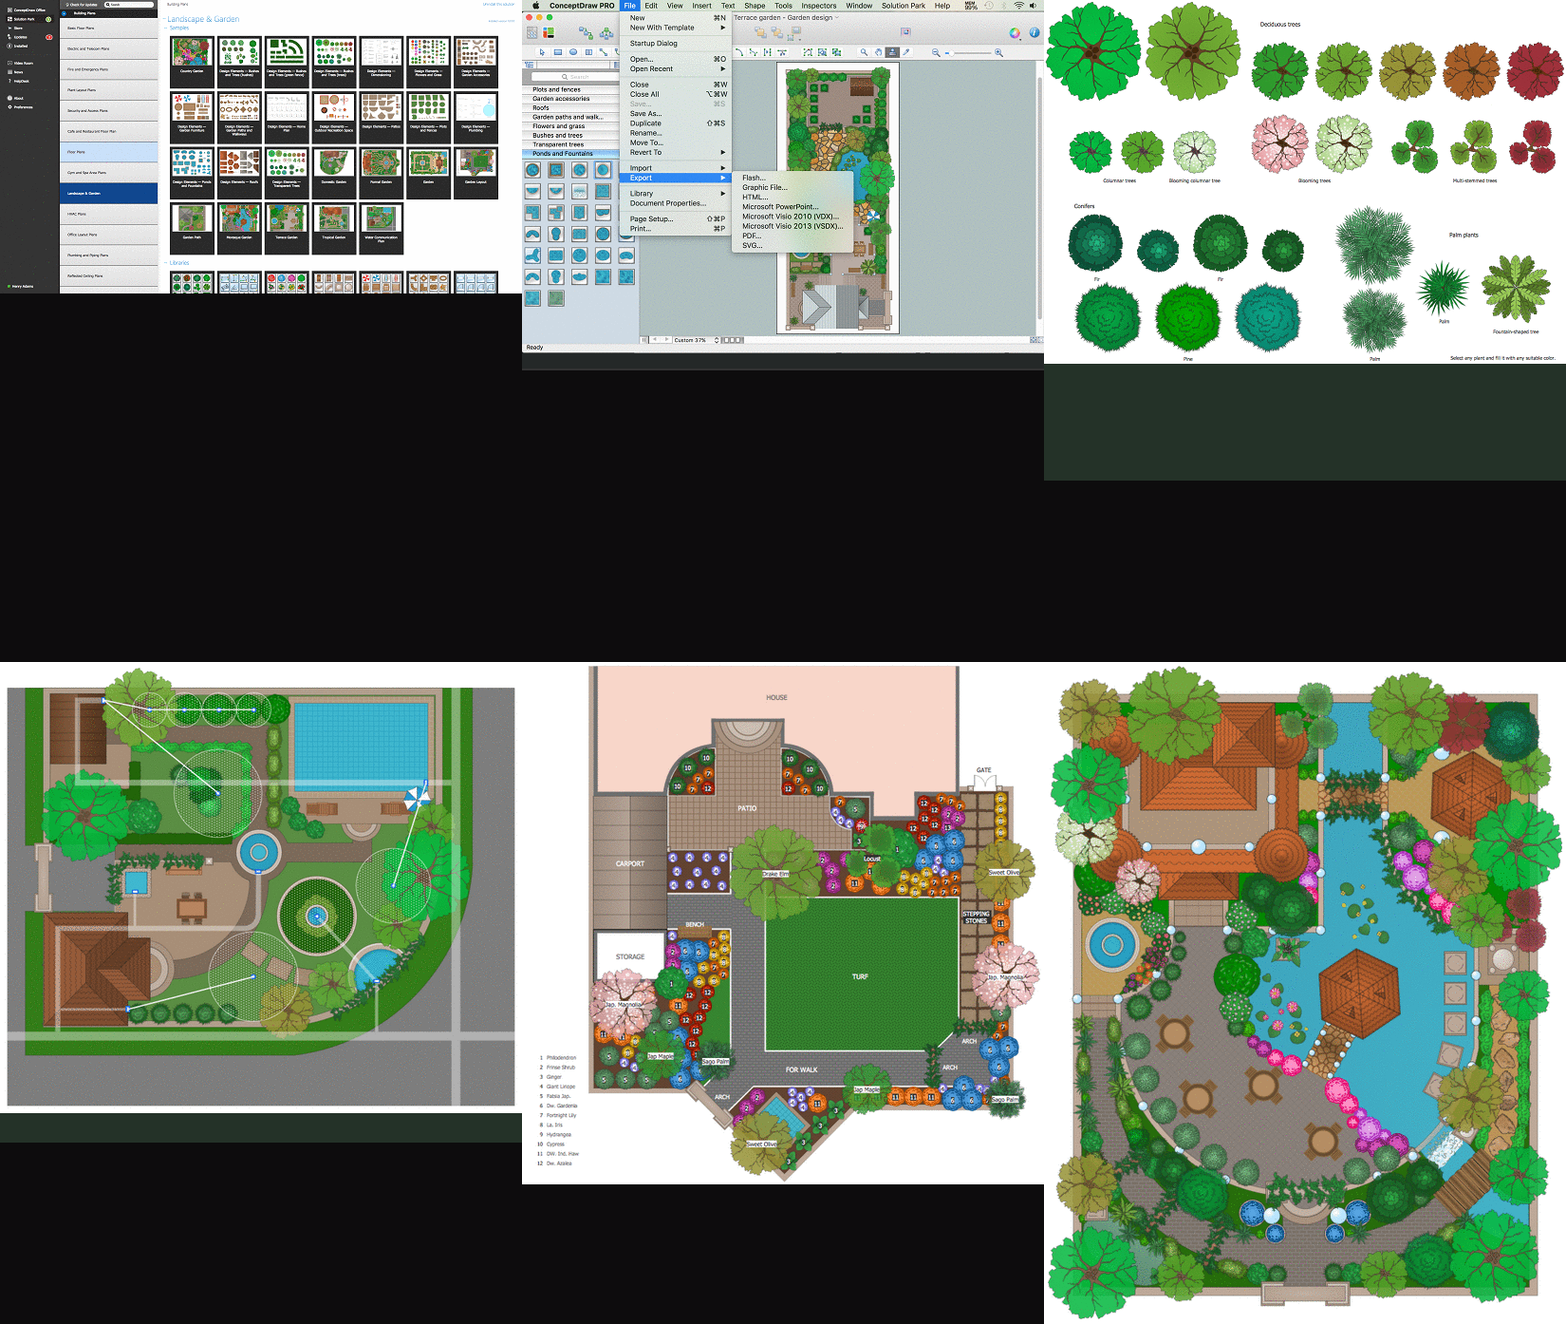
 Landscape & Garden
The Landscape and Gardens solution for ConceptDraw PRO v10 is the ideal drawing tool when creating landscape plans. Any gardener wondering how to design a garden can find the most effective way with Landscape and Gardens solution.
Pie Chart Examples and Templates
A pie chart or a circle graph is a circular chart divided into sectors, illustrating numerical proportion. In a pie chart, the arc length of each sector and consequently its central angle and area, is proportional to the quantity it represents. Pie chart examples and templates created using ConceptDraw PRO software helps you get closer with pie charts and find pie chart examples suite your needs.Pie Chart Word Template. Pie Chart Examples
The Pie Chart visualizes the data as the proportional parts of a whole and looks like a disk divided into sectors. The pie chart is type of graph, pie chart looks as circle devided into sectors. Pie Charts are widely used in the business, statistics, analytics, mass media. It’s very effective way of displaying relative sizes of parts, the proportion of the whole thing.Pie Donut Chart. Pie Chart Examples
This sample shows the Pie Donut Chart. It was created in ConceptDraw PRO diagramming and vector drawing software using the ready-to-use object from the Pie Charts Solution from Graphs and Charts area of ConceptDraw Solution Park. The Pie Donut Chart visualizes the percentage of parts of the whole and looks like as a ring divided into sectors. Pie Donut Charts are widely used in the business, statistics, analytics, mass media.Percentage Pie Chart. Pie Chart Examples
This sample was created in ConceptDraw PRO diagramming and vector drawing software using the Pie Charts Solution from Graphs and Charts area of ConceptDraw Solution Park. This sample shows the Pie Chart of the approximate air composition. You can see the percentage of oxygen, nitrogen and other gases in the air visualized on this Pie Chart.How To use Landscape Design Software
Creation great-looking or even impressive landscape designs is a great labour and real art. There are required the fundamental knowledge in design field, architecture and construction, and also in other special fields, such as plant growing, history, culture, philosophy, etc. Moreover, you need to have good artistic abilities for achievement success in landscape design. All these nuances create the impression that it is incredibly complex process, but ConceptDraw PRO aims to radically change your opinion and make you closer to the realization of your dream. Now thanks to the Landscape & Garden solution included to the Building Plans area of ConceptDraw Solution Park, you can fully concentrate on the creation the masterpieces in landscape design, without worrying about drawing process. Powerful drawing tools and included numerous collection of samples, templates and pre-designed vector objects are helpful for creation Landscape designs and Landscape plans of any complexity and style, they help you unlock your creativity and design easily the lively garden.- Circular Arrows Diagrams | Circular Flow Diagram Template ...
- Pie Divided 5 Psd
- Pie Chart Psd
- Circular arrows diagrams - Vector stencils library | Pie Chart ...
- Arrow circle chart - Template
- Pie Chart Examples and Templates | BPR Diagram. Business ...
- How to Create a Pie Chart | Circular arrows diagrams - Vector ...
- Fire Evacuation Plan Template | Emergency Plan | How To Create ...
- How To Create Restaurant Floor Plan in Minutes | Banquet Hall Plan ...
- Ice Hockey Rink Diagram | Banquet Hall Plan Software | Landscape ...
- National Preparedness Cycle - Arrow ring chart | Circular diagrams ...
- Fire Evacuation Plan Template | Emergency Plan | Banquet Hall ...
- Concept maps - Vector stencils library | What Is a Concept Map ...
- Accounting Icon Psd
- Simple Bubble Diagram Template
- How to Draw the Different Types of Pie Charts | Virtuous circle ...
- Donut Chart
- Pie Chart Software | Doughnut chart - Template | Donut chart ...
- Pie charts - Vector stencils library | Pie Chart Word Template . Pie ...
- Pie Chart Examples and Templates | Pie Chart Software | Doughnut ...


