Process Flowchart
The main reason of using Process Flowchart or PFD is to show relations between major parts of the system. Process Flowcharts are used in process engineering and chemical industry where there is a requirement of depicting relationships between major components only and not include minor parts. Process Flowcharts for single unit or multiple units differ in their structure and implementation. ConceptDraw PRO is Professional business process mapping software for making Process flowcharts, Process flow diagram, Workflow diagram, flowcharts and technical illustrations for business documents and also comprehensive visio for mac application. Easier define and document basic work and data flows, financial, production and quality management processes to increase efficiency of your business with ConcepDraw PRO. Business process mapping software with Flowchart Maker ConceptDraw PRO includes extensive drawing tools, rich examples and templates, process flowchart symbols and shape libraries, smart connectors that allow you create the flowcharts of complex processes, process flow diagrams, procedures and information exchange. Process Flowchart Solution is project management workflow tools which is part ConceptDraw Project marketing project management software. Drawing charts, diagrams, and network layouts has long been the monopoly of Microsoft Visio, making Mac users to struggle when needing such visio alternative like visio for mac, it requires only to view features, make a minor edit to, or print a diagram or chart. Thankfully to MS Visio alternative like ConceptDraw PRO software, this is cross-platform charting and business process management tool, now visio alternative for making sort of visio diagram is not a problem anymore however many people still name it business process visio tools.
Bar Diagrams for Problem Solving. Create manufacturing and economics bar charts with Bar Graphs Solution
Create bar charts for visualizing problem solving in manufacturing and economics using the ConceptDraw PRO diagramming and vector drawing software extended with the Bar Graphs Solution from the Graphs and Charts area of ConceptDraw Solition Park.HelpDesk
How to Draw a Block Diagram in ConceptDraw PRO
Block diagram is a simple chart that use blocks to show some elements or activities, and connectors that show the relationship between neighboring blocks. They are commonly simple, giving an overview of a process without necessarily going into the specifics of implementation. Block diagrams are commonly used to depict a general description of a system and its activity. A most known sample of a block diagram is a flow chart, used in many types of business as a common method of representing repeated processes. Easy and a simple creation, a number of objects and connectors make the block diagram a many-sided tool for various industries. The ability to make block diagrams is delivered by the ConceptDraw Block Diagrams solution.Process Flow Chart
A Process Flow Chart is a type of flowchart which is mostly used in industrial, chemical and process engineering for illustrating high-level processes, major plant processes and not shows minor details. ConceptDraw PRO diagramming and vector drawing software extended with Flowcharts Solution from the "Diagrams" Area of ConceptDraw Solution Park is the best way to create Process Flow Chart and other types of flowcharts.HelpDesk
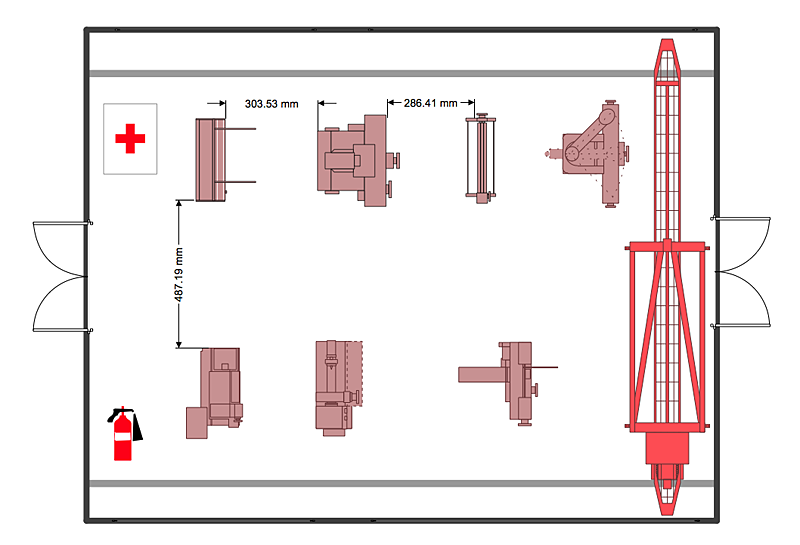
How to Create a Plant Layout Design
A plant construction process begins from a plant layout stage - an engineering stage used to design, analyze and finally choose the suitable configurations for a manufacturing plant. Plant Layout issues are core to any enterprise and are challenged in all types of manufacturing process. The sufficiency of layout influences the efficiency of subsequent operations. It is an important background for efficient manufacturing and also has a great deal with many questions. Once the place of the plant has been determined, the next important task before the management of the plant is to plan appropriate layout for the enterprise. Plant layout is used to create the most effective physical arrangement of machinery and equipment, with the plant building in such a manner so as to make quickest and cheapest way from a raw material to the shipment of the completed product Making a plan that shows the location of industrial equipment involves many different elements that can be managed using ConVenn Diagram Maker
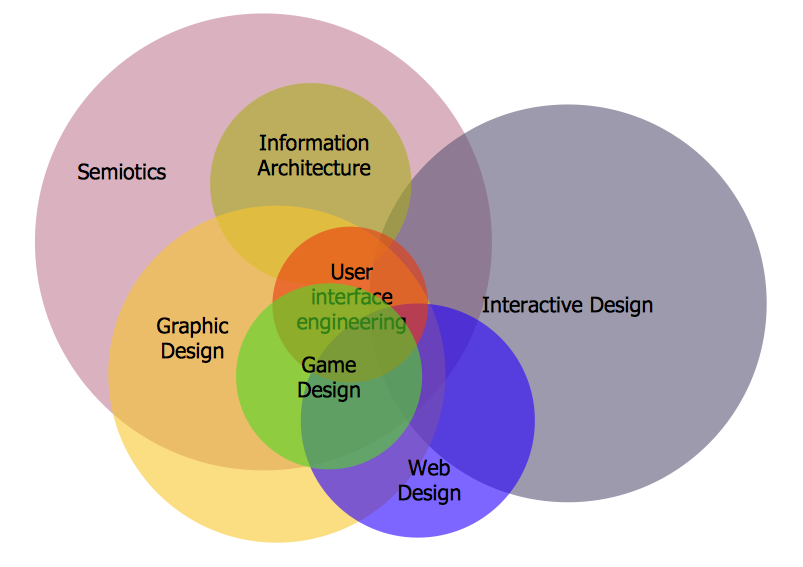
ConceptDraw PRO diagramming and vector drawing software extended with Venn Diagrams solution from the "Diagrams" area of ConceptDraw Solution Park is a powerful Venn Diagram maker. Create fast and easy your own Venn Diagrams to visualize: all the possible logical relations between sets, simple set relationships in logic, statistics, mathematics, sociology, marketing, summarize the status and future viability of a project.Competitor Analysis
Competitor analysis is a first and obligatory step in elaboration the proper corporate marketing strategy and creating sustainable competitive advantage. Use powerful opportunities of numerous solutions from ConceptDraw Solution Park for designing illustrative diagrams, charts, matrices which are necessary for effective competitor analysis.
 Stakeholder Onion Diagrams
The Stakeholder Onion Diagram is often used as a way to view the relationships of stakeholders to a project goal. A basic Onion Diagram contains a rich information. It shows significance of stakeholders that will have has influence to the success achieve
 Business Package for Management
Package intended for professional who designing and documenting business processes, preparing business reports, plan projects and manage projects, manage organizational changes, prepare operational instructions, supervising specific department of an organization, workout customer service processes and prepare trainings for customer service personal, carry out a variety of duties to organize business workflow.
Interactive Venn Diagram
Venn Diagrams Solution offers you the Venn Diagrams library of ready-to-use vector objects and large collection of templates and samples allowing you create your own Interactive Venn Diagram in minutes. Venn Diagrams designed in ConceptDraw PRO are visual, bright, colorful, so they can be successfully used in different reports, appearances on the conferences, meetings.
 Entity-Relationship Diagram (ERD)
Entity-Relationship Diagram (ERD) solution extends ConceptDraw PRO software with templates, samples and libraries of vector stencils from drawing the ER-diagrams by Chen's and crow’s foot notations.
- 2 Circle Venn Diagram . Venn Diagram Example | Industrial ...
- Sector diagram - Template | How To Create Onion Diagram | Pie ...
- Circle Diagram Example In Statistic
- Business Sector Diagram Sample
- How to Draw the Different Types of Pie Charts | Percentage Pie ...
- Emergency management exercise cycle | Circular Flow Diagram ...
- Business Report Pie. Pie Chart Examples | Bar Chart Examples ...
- Competitor Analysis | Block diagram - Porter's five forces model ...
- Relative Circular Diagram | Entity-Relationship Diagram (ERD ...
- National Preparedness Cycle - Arrow ring chart | Program to Make ...
- Pie Chart Examples and Templates | Chart Examples | Donut Chart ...
- Total Quality Management TQM Diagrams | Circular Arrows ...
- Emergency management exercise cycle | Triangle scheme with ...
- Process Flowchart | Program to Make Flow Chart | Basic ...
- Circular arrows diagram - SDLC | Model development life cycle ...
- Sector weightings - Exploded pie chart | Bar Diagrams for Problem ...
- Strategic planning - Cycle diagram | Water cycle diagram | Process ...
- Economic sector weightings | Exploded pie chart (percentage ...
- Basic Flowchart Symbols and Meaning | Circular Flow Diagram ...
- Pyramid Diagram | 3 Circle Venn Diagram . Venn Diagram Example ...


