HelpDesk
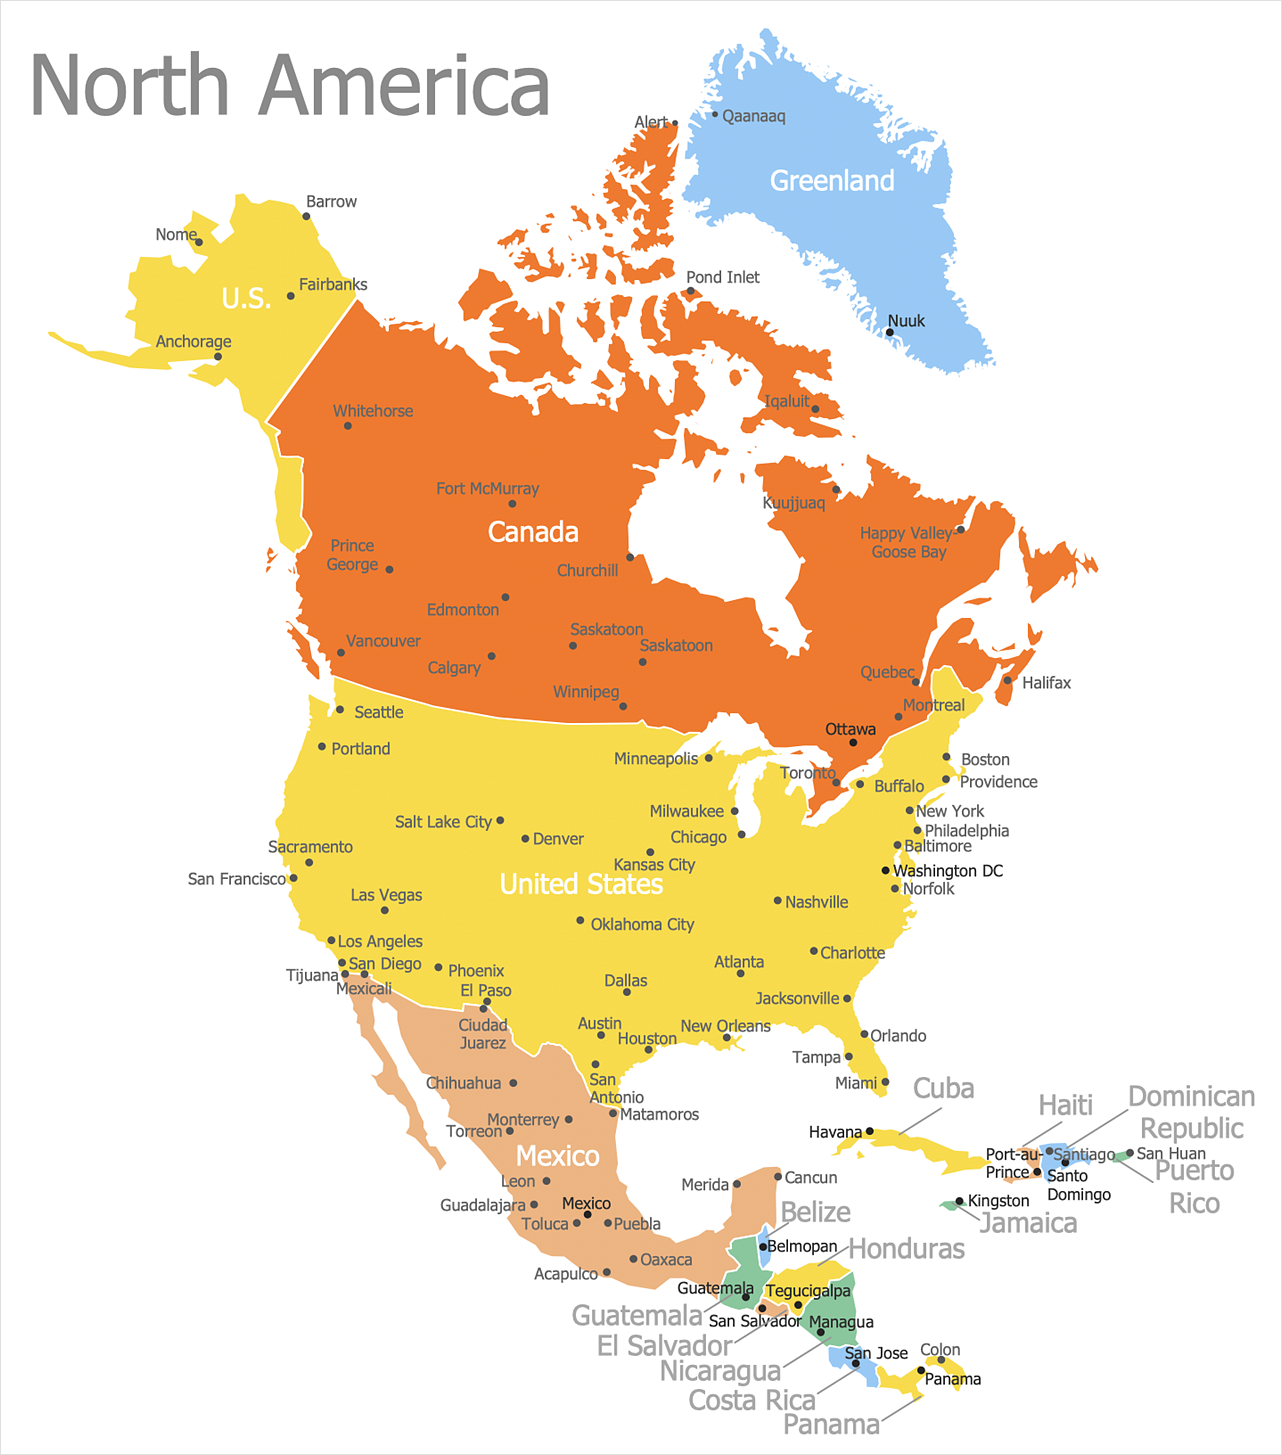
How to Draw a Map of North America
Geographic maps, cardiograms, and thematic maps are often used for geographical visualization of business information. Any country can inspire a wealth of geopolitical statistical data. A common way of assimilating this data is to create maps that convey a particular theme or subject matter in relation to a specific geographical area. Known as thematic maps, they cover themes such as population density, average rainfall, or political allegiance, differentiating the data by using graphical elements and annotation. Thematic maps contrast general reference maps, which tend to display information on a variety of subjects — vegetation, topology, roads, and highways, for example. A thematic map will always focus on one particular subject matter. ConceptDraw DIAGRAM can be helpful as a tool for creating maps of countries and regions of the world. It allows you to draw continental maps quickly and easily using the special templates and vector stencils libraries.
 Nature
This solution extends ConceptDraw DIAGRAM software with samples, templates and libraries of vector clipart for drawing the Nature illustrations. Use it to make professional-looking documents, presentations and websites illustrated with color scalable vector c
Examples of Flowcharts, Org Charts and More
ConceptDraw DIAGRAM covers a broad spectrum of business graphics categories and offers at ConceptDraw STORE enormous online collection of pictorial examples and samples for different thematics and application areas. It is a plentiful source of inspiration and wonderful examples of professionally designed diagrams, flowcharts, UML diagrams, organizational charts, databases, ERDs, network diagrams, business charts, different thematic charts, schematics, infographics and plans developed specially for knowledge workers, engineers, managers, businessmen, marketing specialists, analytics, scientists, students, professors, journalists and also for a large number of other people that every day use various diagrams and drawings in their work and life activity. Each of these examples is a real art, all they are well thought-out and designed without efforts with help of powerful tools of ConceptDraw DIAGRAM software. ConceptDraw examples display all variety of tasks, possibilities and results that ConceptDraw Product Line lets achieve fast and easy. ConceptDraw is one of the best Visio alternatives for Mac. It open all Visio formats like.vsdx,.vss,.vdx files and allows you to export files to Visio formats.
How can you illustrate the weather condition
Use it to make professional looking documents, presentations, and websites illustrated with color scalable vector clipart for geography, weather, and animals.Basic Diagramming
Perfect charts and graphics diagramming software with rich examples and template. ConceptDraw is ideal to draw Charts and Graphics.
 Universal Diagramming Area
This area collects solutions for drawing diagrams, charts, graphs, matrices, geographic and road maps for education, science, engineering, business.
 Divided Bar Diagrams
The Divided Bar Diagrams Solution extends the capabilities of ConceptDraw DIAGRAM with templates, samples, and a library of vector stencils for drawing high impact and professional Divided Bar Diagrams and Graphs, Bar Diagram Math, and Stacked Graph.
 UK Map
The Map of UK solution contains collection of professionally designed samples and scalable vector stencil graphics maps, representing the United Kingdom counties, regions and cities. Use the Map of UK solution from ConceptDraw Solution Park as the base fo
Bar Diagrams for Problem Solving. Create manufacturing and economics bar charts with Bar Graphs Solution
Create bar charts for visualizing problem solving in manufacturing and economics using the ConceptDraw DIAGRAM diagramming and vector drawing software extended with the Bar Graphs Solution from the Graphs and Charts area of ConceptDraw Solition Park.
 Continent Maps
Continent Maps solution extends ConceptDraw DIAGRAM software with templates, samples and libraries of vector stencils for drawing the thematic maps of continents, state maps of USA and Australia.
- Basic Flowchart Symbols and Meaning | Circular Flow Diagram ...
- Water cycle diagram | Quality Management System | Circular Arrows ...
- Pie Chart Examples and Templates | Target and Circular Diagrams ...
- Water cycle diagram | Snow Diagrams In Geography
- Schedule pie chart - Daily action plan | Composition Dashboard ...
- Waterfall Bar Chart | Geography - Vector stencils library | SSADM ...
- Geography Diagram
- Target and Circular Diagrams | Composition Dashboard | Project ...
- Continent Maps | Sales Dashboard | Geo Map - Europe - Iceland ...
- Schedule pie chart - Daily action plan | Flow Chart Symbols | Target ...
- Business Intelligence Dashboard Software | Design elements ...
- How to Draw a Circular Arrows Diagram Using ConceptDraw PRO ...
- Business Intelligence Dashboard Software | | Design elements ...
- Geography - Vector stencils library | Geography - Vector stencils ...
- Schedule pie chart - Daily action plan
- Water cycle diagram | Circular arrows diagram - PDCA cycle ...
- Universal Diagramming Area | Basic Diagramming | Value Stream ...
- How To Draw Flow Diagram Geography
- Energy resources diagram | Circular Arrows Diagrams | Rolla USGS ...
- Schedule pie chart - Daily action plan | Project Management Area ...


