Infographic software: the sample of New York City Subway map

"San Francisco ..., officially the City and County of San Francisco, is the leading financial and cultural center of Northern California and the San Francisco Bay Area.
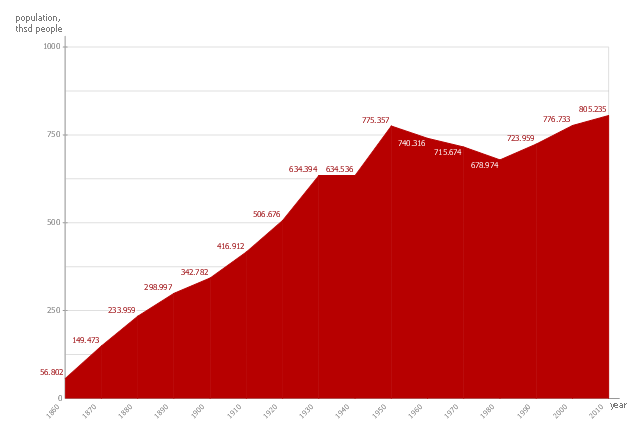
The only consolidated city-county in California, San Francisco encompasses a land area of about 46.9 square miles (121 km2) on the northern end of the San Francisco Peninsula, giving it a density of about 17,620 people per square mile (6,803 people per km2). It is the most densely settled large city (population greater than 200,000) in the state of California and the second-most densely populated major city in the United States after New York City. San Francisco is the fourth most populous city in California, after Los Angeles, San Diego and San Jose, and the 14th most populous city in the United States—with a Census-estimated 2012 population of 825,863. The city is also the financial and cultural hub of the larger San Jose-San Francisco-Oakland metropolitan area, with a population of 8.4 million." [San Francisco. Wikipedia]
The area chart example "San Francisco population history" was created using the ConceptDraw PRO diagramming and vector drawing software extended with the Area Charts solution from the Graphs and Charts area of ConceptDraw Solution Park.
Area chart
Geo Map - Asia - Philippines

Use the Continent Maps solution and Philippines library to draw thematic maps, geospatial infographics and vector illustrations. This solution to help visualize the business and thematic information connected with geographic areas, locations or customs; for your business documents, presentations and websites.
Geo Map - Europe - Romania

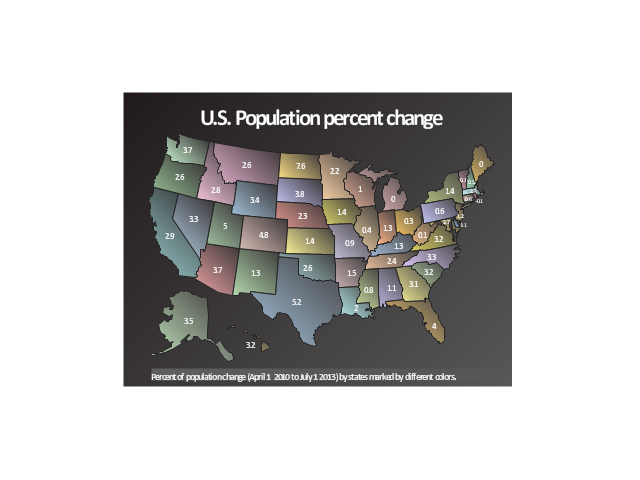
This sample was drawn on the base of the spatial dashboard "U.S. Population percent change" from the United States Census Bureau website.
[quickfacts.census.gov/ qfd/ index.html]
"As of March 20, 2014, the United States has a total population of 317 million, making it the third-most populous country in the world. It is very urbanized, with 82% residing in cities and suburbs as of 2011 (the worldwide urban rate is 52%). California and Texas are the most populous states, as the mean center of U.S. population has consistently shifted westward and southward. New York City is the most populous city in the United States.
The total fertility rate in the United States estimated for 2012 is 1.88 children per woman, which is below the replacement fertility rate of approximately 2.1. Compared to other Western countries, in 2011, U.S. fertility rate was lower than that of France (2.02) and the United Kingdom (1.97). However, U.S. population growth is among the highest in industrialized countries, because the differences in fertility rates are less than the differences in immigration levels, which are higher in the U.S. The United States Census Bureau shows population increase of 0.75% for the twelve-month period ending in July 2012. Though high by industrialized country standards, this is below the world average annual rate of 1.1%.
There were over 158.6 million females in the United States in 2009. The number of males was 151.4 million. At age 85 and older, there were more than twice as many women as men. People under 20 years of age made up over a quarter of the U.S. population (27.3%), and people age 65 and over made up one-eighth (12.8%) in 2009. The national median age was 36.8 years." [Demographics of the United States. Wikipedia]
The geospatial dashboard example "U.S. Population, percent change, 2010 to 2013" was created using the ConceptDraw PRO diagramming and vector drawing software extended with the Spatial Dashboard solution from the area "What is a Dashboard" of ConceptDraw Solution Park.
Geospatial dashboard
Geo Map - USA - Nevada

The vector stencils library Nevada contains contours for ConceptDraw PRO diagramming and vector drawing software. This library is contained in the Continent Maps solution from Maps area of ConceptDraw Solution Park.
Geo Map - Australia - Victoria

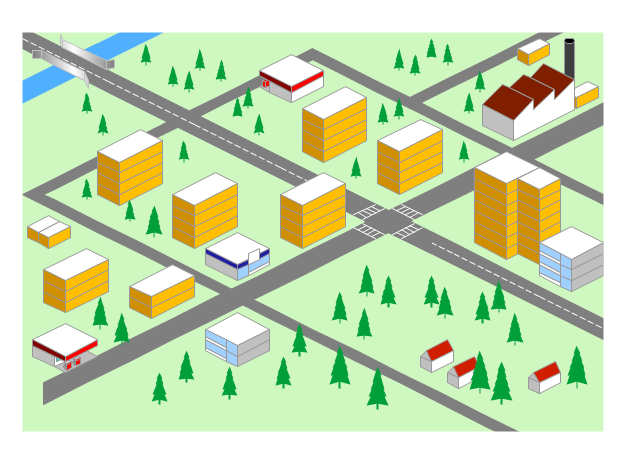
"Road maps come in many shapes, sizes and scales. Small, single-page maps may be used to give an overview of a region's major routes and features. ...
Highway maps generally give an overview of major routes within a medium to large region ranging from a few dozen to a few thousand miles or kilometers.
Street maps usually cover an area of a few miles or kilometers (at most) within a single city or extended metropolitan area. City maps are generally a specialized form of street map." [Road map. Wikipedia]
This 3D pictorial road map example was created using the ConceptDraw PRO diagramming and vector drawing software extended with the Directional Maps solution from the Maps area of ConceptDraw Solution Park.
3D Directional map
Geo Map - Europe - Bosnia and Herzegovina

Geo Map - Europe - Croatia

Geo Map - South America - Cuba

The vector stencils library Cuba contains contours for ConceptDraw PRO diagramming and vector drawing software. This library is contained in the Continent Maps solution from Maps area of ConceptDraw Solution Park.
Geo Map - USA - Tennesse

The vector stencils library Tennesse contains contours for ConceptDraw PRO diagramming and vector drawing software. This library is contained in the Continent Maps solution from Maps area of ConceptDraw Solution Park.
Geo Map - Europe - Montenegro

Geo Map - USA - Oklahoma

The vector stencils library Oklahoma contains contours for ConceptDraw PRO diagramming and vector drawing software. This library is contained in the Continent Maps solution from Maps area of ConceptDraw Solution Park.
Geo Map - South America - El Salvador

The vector stencils library El Salvador contains contours for ConceptDraw PRO diagramming and vector drawing software. This library is contained in the Continent Maps solution from Maps area of ConceptDraw Solution Park.
Geo Map - Canada - Ontario

The vector stencils library Ontario contains contours for ConceptDraw PRO diagramming and vector drawing software. This library is contained in the Continent Maps solution from Maps area of ConceptDraw Solution Park.
 Maps
Maps
This solution extends ConceptDraw PRO v9.4 with the specific tools necessary to help you draw continental, directional, road, or transit maps, to represent international, business, or professional information visually.
"A world clock is a clock which displays the time for various cities around the world. The display can take various forms:
(1) The clock face can incorporate multiple round analogue clocks with moving hands or multiple digital clocks with numeric readouts, with each clock being labelled with the name of a major city or time zone in the world.
(2) It could also be a picture map of the world with embedded analog or digital time-displays.
(3) A moving circular map of the world, rotating inside a stationary 24 hour dial ring. Alternatively, the disc can be stationary and the ring moving.
(4) Light projection onto a map representing daytime, used in the Geochron, a brand of a particular form or world edvin.
There are also worldtime watches, both wrist watches and pocket watches. Sometime manufacturers of timekeepers erroneously apply the worldtime label to instruments that merely indicate time for two or a few time zones, but the term should be used only for timepieces that indicate time for all major time zones of the globe." [World clock. Wikipedia]
The example "iPhone OS (iOS) graphic user interface (GUI) - Clock application" was created using the ConceptDraw PRO diagramming and vector drawing software extended with the Graphic User Interface solution from the Software Development area of ConceptDraw Solution Park.
iPhone GUI
-graphic-user-interface-(gui)---clock-application.png--diagram-flowchart-example.png)
Geo Map - Canada - Saskatchewan

The vector stencils library Saskatchewan contains contours for ConceptDraw PRO diagramming and vector drawing software. This library is contained in the Continent Maps solution from Maps area of ConceptDraw Solution Park.
- Infographic software: the sample of New York City Subway map ...
- How to draw Metro Map style infographics? (New York) | New York ...
- How to draw Metro Map style infographics? (New York) | New York ...
- Infographic software: the sample of New York City Subway map ...
- Area chart - San Francisco population history | - Conceptdraw.com
- Area Charts | Area chart - San Francisco population history | Area ...
- Line Chart Examples | Line chart - Evolution of the population | Area ...
- Financial Comparison Chart | Bar Diagrams for Problem Solving ...
- Maps | Transit map template | Metro Map |
- How to draw Metro Map style infographics? (New York) | Metro Map ...
- Metro Map | How to draw Metro Map style infographics? Moscow ...
- How to draw Metro Map style infographics? (New York) | How to ...
- How to draw Metro Map style infographics? (New York) | Infographic ...
- Infographic design elements, software tools Subway and Metro style ...
- How to draw Metro Map style infographics? (New York) | Subway ...
- Political map of Europe
- Picture graph - Population growth by continent, 2010 - 2013 | Line ...
- Spatial infographics Design Elements: Transport Map
- Bar Diagrams for Problem Solving. Create economics and financial ...
- Map Infographic Design