UML Class Diagram Example - Social Networking Site
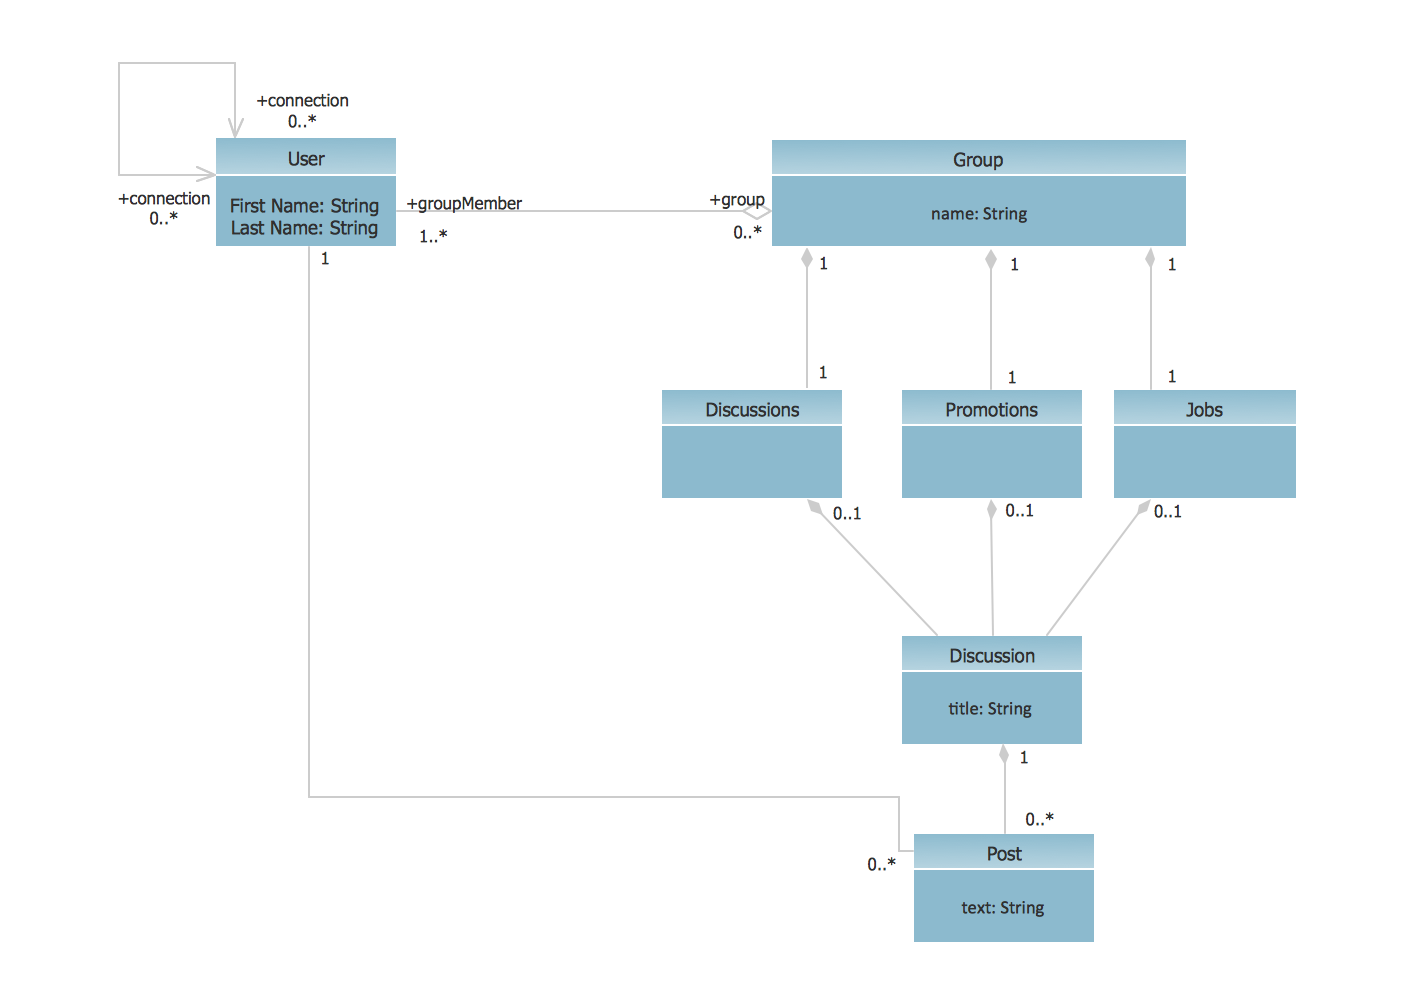
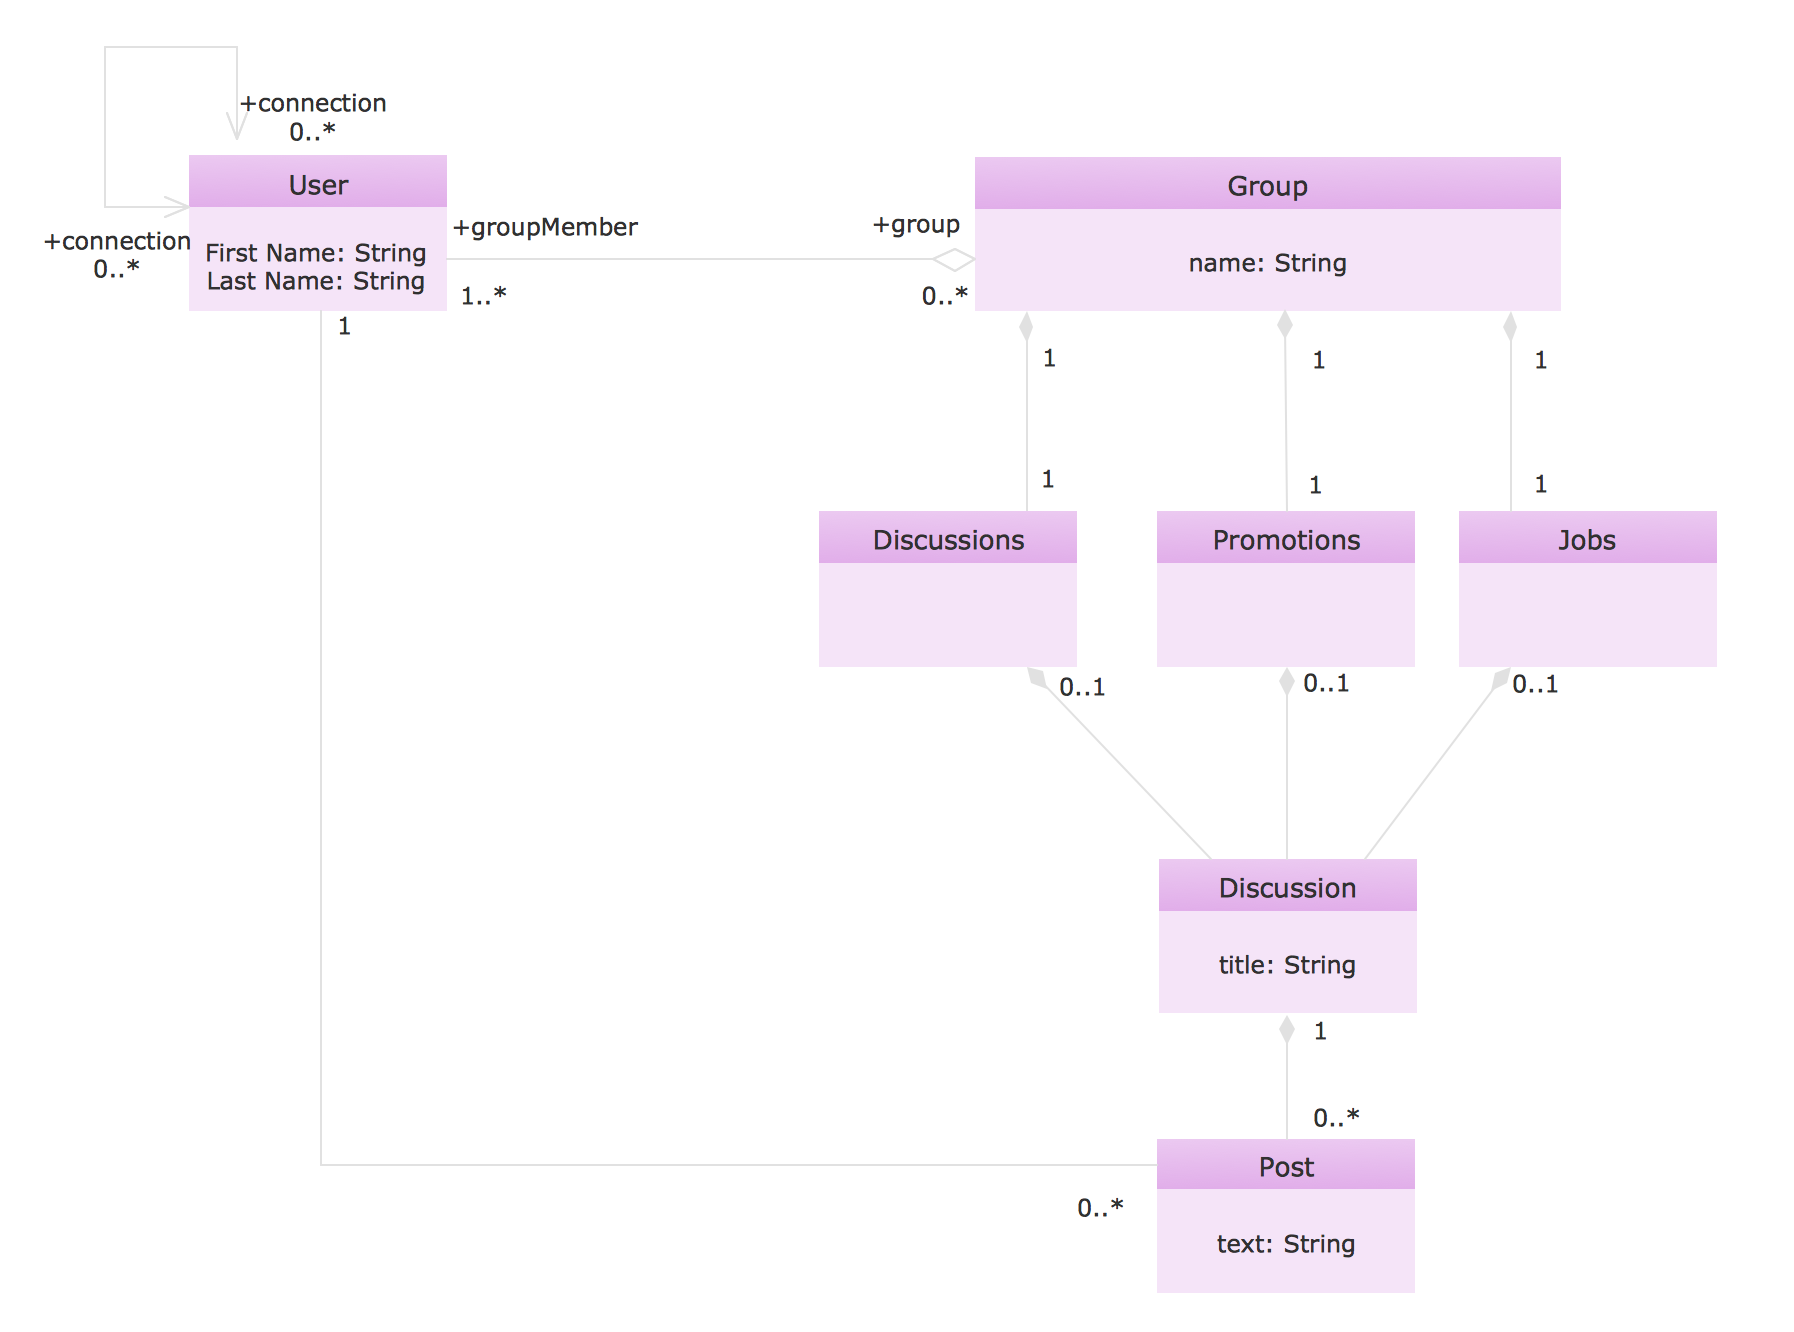
UML Diagrams Social Networking Sites Project. This sample was created in ConceptDraw DIAGRAM diagramming and vector drawing software using the UML Class Diagram library of the Rapid UML Solution from the Software Development area of ConceptDraw Solution Park. This sample shows the structure of the popular social networking site Linkedin and is used in the business field, in IT, at the projection and creating of the social networking sites.UML Use Case Diagram Example. Social Networking Sites Project
UML Diagrams Social Networking Sites Project. This sample was created in ConceptDraw DIAGRAM diagramming and vector drawing software using the UML Use Case Diagram library of the Rapid UML Solution from the Software Development area of ConceptDraw Solution Park. This sample shows the Facebook Socio-health system and is used at the projection and creating of the social networking sites.Social Media UML
Social Media UML - This sample shows the structure of the popular social networking site Linkedin. This is a Class Diagram on that classes are represented as boxes and are connected with aggregation, composition associations. This sample can be used in the business field, in IT, at the projection and creating of the social networking sites.
 Universal Diagramming Area
This area collects solutions for drawing diagrams, charts, graphs, matrices, geographic and road maps for education, science, engineering, business.
Line Chart Examples
The Line Graphs solution from Graphs and Charts area of ConceptDraw Solution Park contains a set of examples, templates and design elements library of line and scatter charts. Use it to draw line and scatter graphs using ConceptDraw DIAGRAM diagramming and vector drawing software for illustrating your documents, presentations and websites.Entity Relationship Software
Entity Relationship Diagram (ERD) is a leading data modeling tool that is used to illustrate the logical structure of database, helps to organize and represent your project's data in terms of entities, attributes and relationships. To describe the database structure usually is used the ERD Chen's or Crow's Foot notation. Chen's notation supposes the representation of entities by rectangles with the entities names inside, relationships by diamonds and attributes by ovals connected with a line to exactly one entity. In Crow's Foot notation the boxes are used to depict the entities and their attributes, the lines between them - to depict relationships. ConceptDraw DIAGRAM software extended with Entity-Relationship Diagram (ERD) Solution is convenient and useful for designing the ER Diagrams, and supports the use of Chen's or Crow’s Foot notation according to your needs and desires. The ERD diagrams produced with ConceptDraw DIAGRAM Entity Relationship Diagram software can be successfully used in whitepapers, presentations, posters, datasheets, technical materials, etc.- UML Class Diagram Example - Social Networking Site | UML Use ...
- UML Use Case Diagram Example Social Networking Sites Project ...
- UML Use Case Diagram Example Social Networking Sites Project
- UML Class Diagram Example - Social Networking Site | Social ...
- IVR Network Diagram | UML Use Case Diagram Example Social ...
- UML Class Diagram Example - Social Networking Site | UML Class ...
- UML Class Diagram
- Wireless Networking for Mac | Design elements - Local vehicular ...
- UML Class Diagram Example
- Network Diagram Examples
- Use Case Diagrams technology with ConceptDraw PRO
- UML Use Case Diagram Example Social Networking Sites Project |
- UML Tool & UML Diagram Examples
- UML Tool & UML Diagram Examples
- UML Use Case Diagram Example Social Networking Sites Project ...
- UML Diagrams with ConceptDraw PRO | UML Class Diagram ...
- Diagramming Software for Design UML State Machine Diagrams ...
- UML Class Diagram Constructor
- UML Diagrams with ConceptDraw PRO | UML Activity Diagram ...
- UML Diagrams with ConceptDraw PRO | UML Class Diagrams ...


