UML Class Diagram Constructor
UML Class Diagrams is a type of static structure diagram that is used both for general conceptual modeling of the systematics of the application, and for detailed modeling translating the models into programming code. It describes the structure of a system by showing the: classes of a system, attributes, operations, and the relationships between them. The Rapid UML Solution for ConceptDraw DIAGRAM includes the UML Class Diagram library that helps you to design the UML Class Diagram quick and easy. You can simply and quickly drop the ready-to-use objects from the library into your document to create the UML Class Diagram.UML Class Diagram. Design Elements
UML Class Diagrams describes the structure of a system by showing the system's classes, their attributes, and the relationships among the classes.UML Notation
Unified Modeling Language (UML) is an open standard, the language of graphic description used for modeling objects in a field of software development and software engineering. It was created for definition, specification, visualization, designing and documenting software systems, as a unification of three object-oriented technologies Booch, OMT and OOSE, and uses the defined graphic notation for creating the visual models of object-oriented software systems. Description of UML consists of two parts, interactive and supplementing each other: UML semantics, which represents a certain metamodel, defines the abstract syntax and semantics of terms of object modeling with UML, and UML notation that is a graphic notation for visual representation of UML semantics. The powerful tools of the Rapid UML solution included to ConceptDraw Solution Park make the ConceptDraw DIAGRAM diagramming and vector drawing software the best for easy applying the UML notation when creating the visual models of object-oriented software systems and designing different kinds of UML diagrams.Business Process Modeling Notation Template
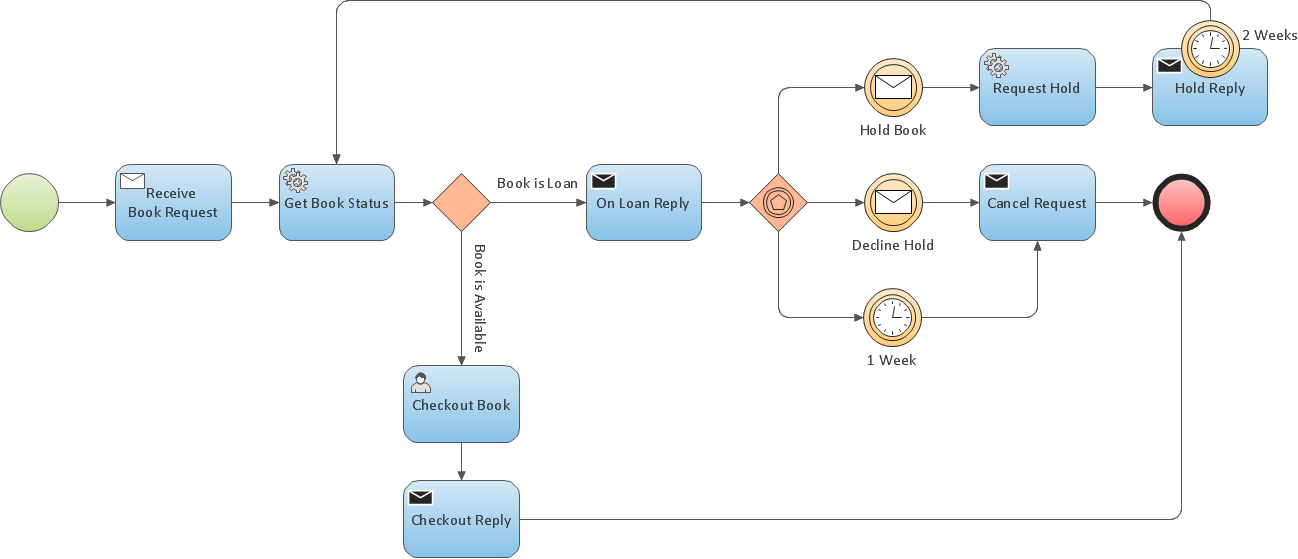
Create business process diagrams (BPMN 2.0.) with ConceptDraw using professional looking templates and business process improvement tools.IDEF3 Standard
Use Case Diagrams technology. IDEF3 Standard is intended for description and further analysis of technological processes of an enterprise. Using IDEF3 standard it is possible to examine and model scenarios of technological processes.How to Draw a Computer Network Diagrams
ConceptDraw DIAGRAM enhanced with popular Computer Network Diagrams solution from Computer and Networks area of ConceptDraw Solution Park is a powerful vector graphics and computer network diagramming software. It includes templates, samples and 7 libraries with predesigned vector objects of computer network devices, computer peripheral devices, network hardware, external digital devices, internet symbols, logical symbols, to help IT professionals easily visualize network equipment, to draft and present computer and network installations. It assists create easy and even instantly Computer Network Diagrams of various types and complexity, design Wireless Network Schemes, Network Topologies Diagrams, Computer Network System Designs. The list of five the most popular practical applications of Computer Network Diagrams solution includes documentation, presentations, training, workflows, education. A represented video How to Draw a Computer Network Diagram will help to realize effectively your computer network design process.Business Process Modeling Resume
ConceptDraw DIAGRAM is a best business processes modeling software for graphical documenting processes of the company.SysML
Systems Modeling Language (SysML) is a general-purpose modeling language for systems engineering applications. ConceptDraw DIAGRAM diagramming and vector drawing software was extended with SysML Solution from the Software Development Area of ConceptDraw Solution Park specially to help systems engineers design various model systems with SysML.Design Pictorial Infographics. Design Infographics
In the course of recent decades data visualization went through significant development and has become an indispensable tool of journalism, business intelligence and science. The way visual information may be conveyed is not limited simply to static or dynamic representation, it can also be interactive. Infographics can be conditionally divided into several general levels. Primarily, this is level of visualization of information, its interpretation and association on any ground. Second level can be defined as a visualization of knowledge, depiction of thoughts and ideas in the form of images or diagrams. Finally, the level of data visualization, which processes data arrays in charts, enabling the information to be more clearly perceived. You can also identify the main approaches to the creation of infographics: exploratory and narrative. Exploratory method insists on minimalist design in favor of data precision without unnecessary details and is common for scientific researches and anaBPMN 2.0
ConceptDraw DIAGRAM diagramming and vector drawing software offers the Business Process Diagram Solution from the Business Processes Area of ConceptDraw Solution Park with powerful tools to help you easy represent the business processes and create the business process diagrams based on BPMN 2.0 standard.- UML Class Diagram Constructor | Private Functions In A Class ...
- UML Class Diagram Constructor | UML Block Diagram | Cisco ...
- Uml Class Diagram For Platform
- Flow chart Example. Warehouse Flowchart | Network Diagram ...
- UML Class Diagram Example - Social Networking Site | UML Use ...
- ATM UML Diagrams | UML use case diagram - Banking system ...
- UML Class Diagram . Design Elements | IDEF0 Visio | Electric and ...
- Private And Public Business Diagrams
- Using Remote Networking Diagrams | Network Diagram Examples ...
- Diagramming Software for Design UML Collaboration Diagrams ...


