Design Elements for UML Diagrams
The Rapid UML solution from Software Development area of ConceptDraw Solution Park includes 13 vector stencils libraries for drawing the UML 2.4 diagrams using ConceptDraw DIAGRAM diagramming and vector drawing software.UML Use Case Diagram Example - Taxi Service
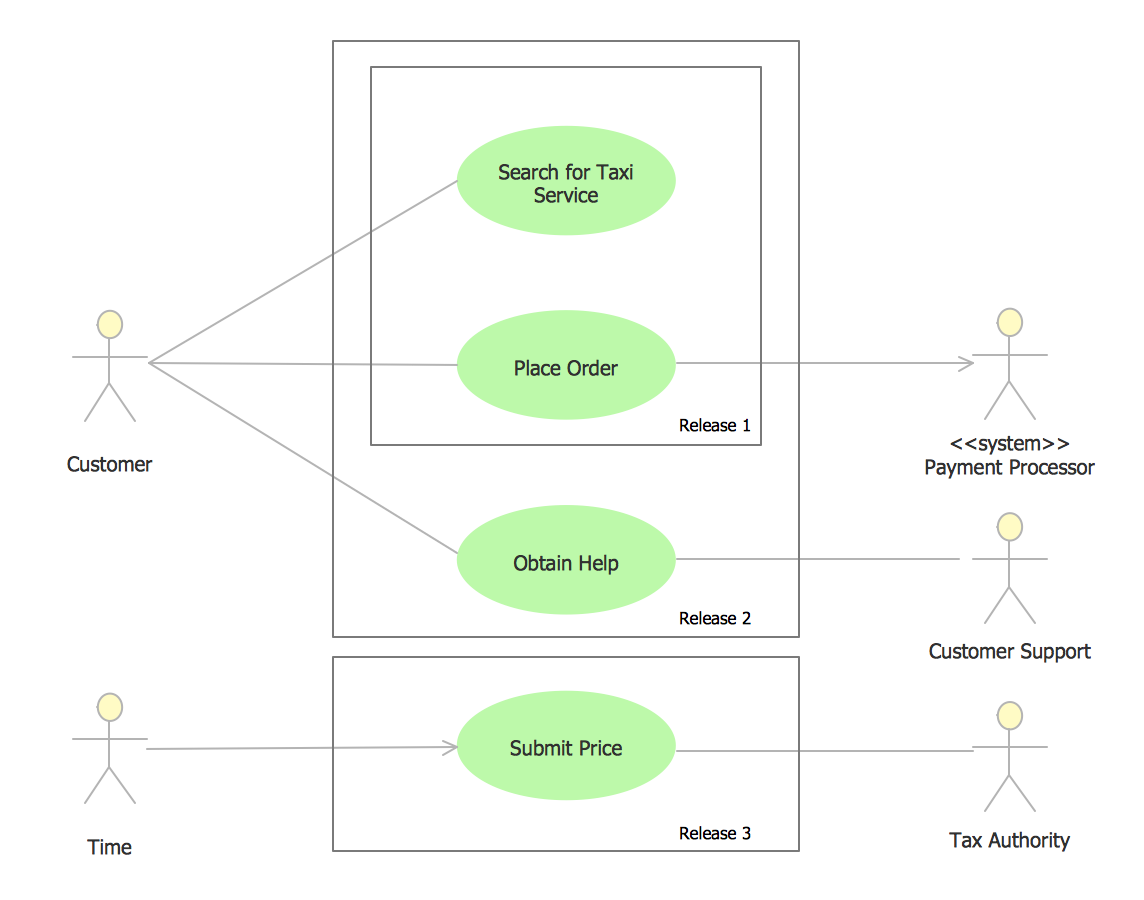
UML Use Case Diagram Taxi Service - This sample was created in ConceptDraw DIAGRAM diagramming and vector drawing software using the UML Use Case Diagram library of the Rapid UML Solution from the Software Development area of ConceptDraw Solution Park. This sample shows the work of the taxi service and is used by taxi stations, by airports, in the tourism field and delivery service.Entity Relationship Diagram Examples
ConceptDraw DIAGRAM diagramming and vector drawing software offers the Entity-Relationship Diagram (ERD) Solution from the Software Development Area for ConceptDraw Solution Park. How many examples contains the Entity-Relationship Diagram (ERD) Solution! All Entity Relationship Diagram examples were designed and saved for ConceptDraw DIAGRAM users. Now they are available from ConceptDraw STORE.
 Oil and Gas
The Oil and Gas solution for ConceptDraw DIAGRAM software provides vector libraries of oil and gas symbols and a collection of samples for quick and simple designing of the oil and gas industry infographics, illustrations, presentations, diagrams. The resulting oil and gas graphics and illustrations help to clearly and quickly detail complex information. They are ideal for reporting on the development of best practices in oil and gas exploration and production. Use them to illustrate growth strategies and trends in the oil industry, conduct analysis, forecast the energy industry, and present the results of international energy forums.
 Entity-Relationship Diagram (ERD)
Entity-Relationship Diagram (ERD) solution extends ConceptDraw DIAGRAM charting and vector drawing software with the ability to describe a database using the Entity-Relationship model. This solution includes icons advocated by Chen’s and Crow’s Foot notation that can be used when describing a database. The vector graphic diagrams produced when using this solution can be employed in your white papers, presentations, data sheets, posters, or any technical material.
Electrical Symbols — Stations
A power station is an industrial facility for the generation of electric power. Most power stations contain one or more generators, a rotating machine that converts mechanical power into electrical power. The relative motion between a magnetic field and a conductor creates an electrical current. The energy source harnessed to turn the generator varies widely. Most power stations in the world burn fossil fuels such as coal, oil, and natural gas to generate electricity. Others use nuclear power, but there is an increasing use of cleaner renewable sources such as solar, wind, wave and hydroelectric. 26 libraries of the Electrical Engineering Solution of ConceptDraw DIAGRAM make your electrical diagramming simple, efficient, and effective. You can simply and quickly drop the ready-to-use objects from libraries into your document to create the electrical diagram. Mechanical Drawing Symbols F.A.Q. How to Use Mechanical Engineering Design Software
Mechanical Drawings are the special type of technical diagrams that visualize the structure of complex systems and illustrate the information about ventilation, heating, air conditioning, i.e. HVAC systems. These drawings are created on the base of floor plans and reflected ceiling plans, and then become an obligatory part of construction project which is needed directly for construction a building and for receiving a permit on it. Mechanical drawings and diagrams help effectively represent construction, technical and engineering solutions, and also schematics of different mechanical equipment.
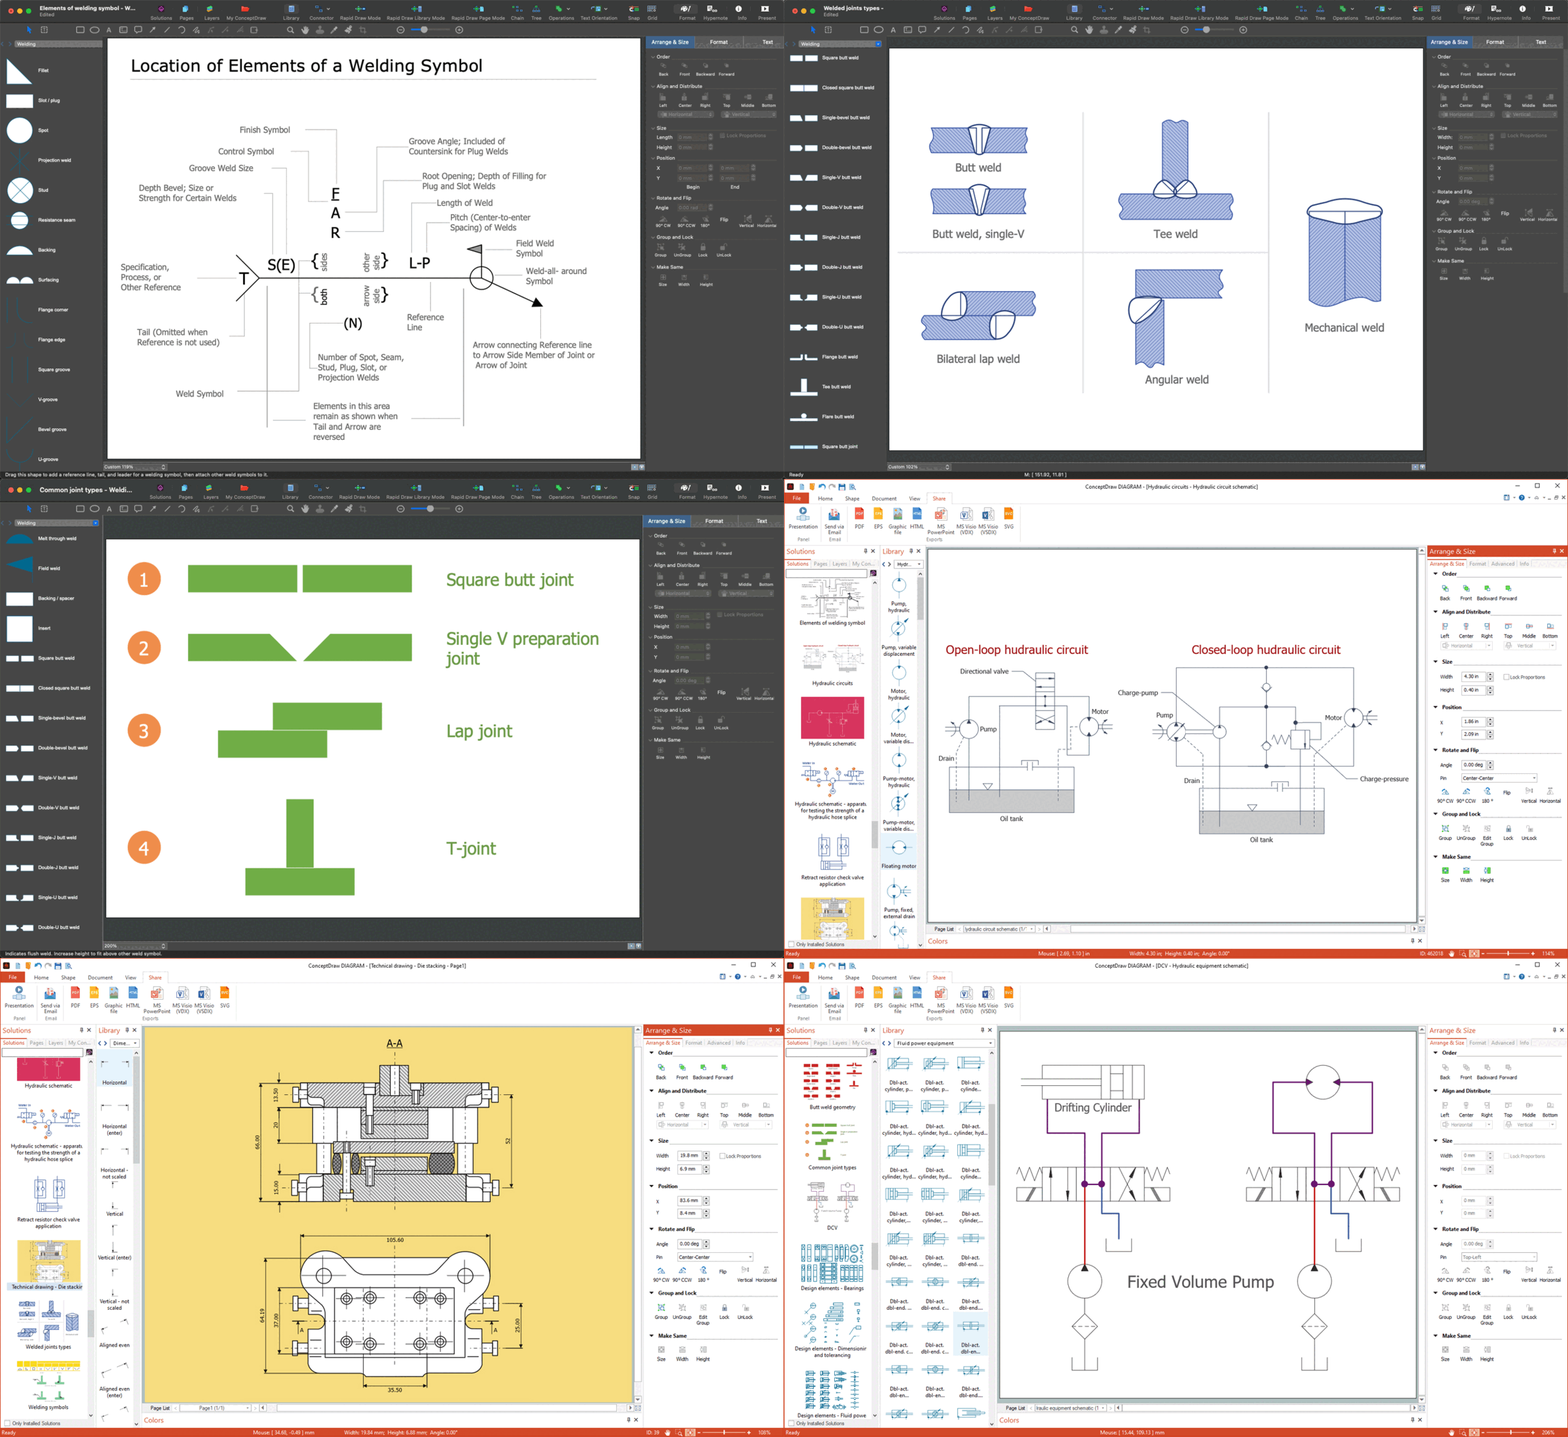
ConceptDraw DIAGRAM ector drawing software enhanced with Mechanical Engineering solution from Engineering area of ConceptDraw Solution Park provides wide set of effective drawing tools, predesigned mechanical drawing symbols, templates, samples and examples. Use of standardized and recognized mechanical vector symbols helps you design understandable mechanical drawings, diagrams and mechanical engineering schematics.
 Jackson Structured Programming (JSP) Diagrams
The Jackson Structured Programming (JSP) Diagram solution extends the functionality and drawing abilities of the ConceptDraw DIAGRAM software with set of illustrative JSP diagrams samples and large variety of predesigned vector objects of actions, processes, procedures, selection, iteration, as well as arrows and connectors to join the objects during Jackson structured development and designing Jackson structured programming diagrams, JSP diagram, Jackson structure diagram (JSD), Program structure diagram. The powerful abilities of this solution make the ConceptDraw DIAGRAM ideal assistant for programmers, software developers, structural programmers, computer engineers, applications constructors, designers, specialists in structured programming and Jackson systems design, and other technical, computer and software specialists.
 HVAC Plans
Use HVAC Plans solution to create professional, clear and vivid HVAC-systems design plans, which represent effectively your HVAC marketing plan ideas, develop plans for modern ventilation units, central air heaters, to display the refrigeration systems for automated buildings control, environmental control, and energy systems.
 Chemical and Process Engineering
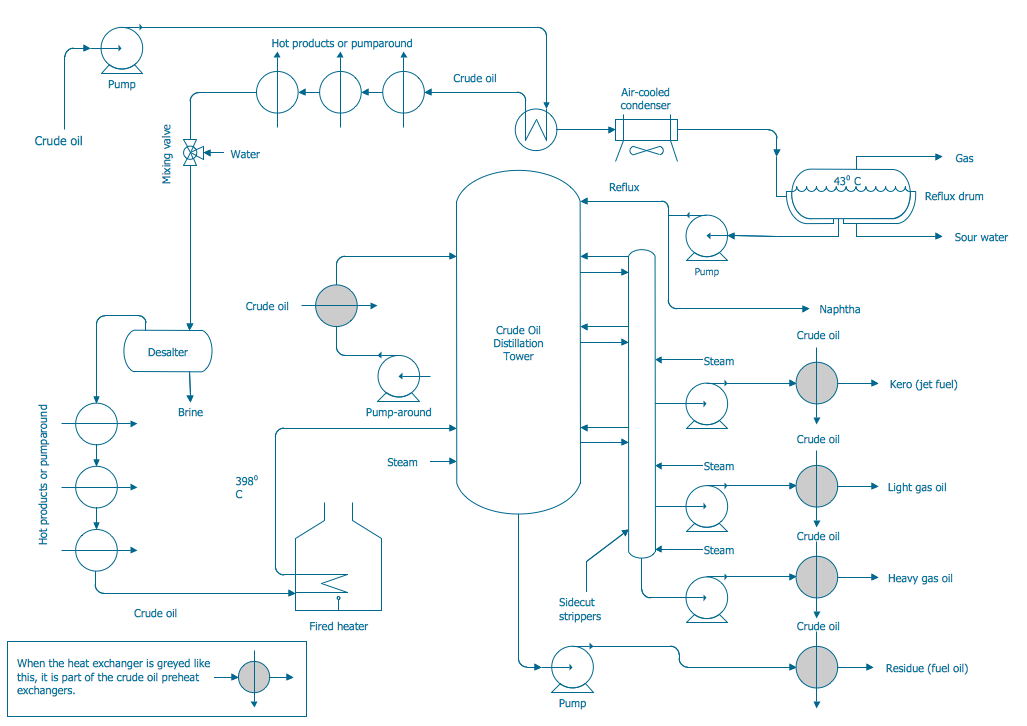
Extending the ConceptDraw DIAGRAM diagramming and drawing software with process flow diagram symbols, samples, process diagrams templates and libraries of design elements for creating process and instrumentation diagrams, block flow diagrams, process flow diagrams, and piping and instrumentation diagrams for chemical and process engineering, the Chemical and Process Engineering solution can be used by both chemical and project engineers, as well as the chemists for creating the needed drawings.
Flowchart Components
The ConceptDraw Flowchart component includes a set of samples and templates. This geathered as flowchart maker toolbox which focused on drawing flowcharts of any industry standards.Example of DFD for Online Store (Data Flow Diagram)
Data Flow Diagram (DFD) is a methodology of graphical structural analysis and information systems design, which describes the sources external in respect to the system, recipients of data, logical functions, data flows and data stores that are accessed. DFDs allow to identify relationships between various system's components and are effectively used in business analysis and information systems analysis. They are useful for system’s high-level details modeling, to show how the input data are transformed to output results via the sequence of functional transformations. For description of DFD diagrams are uses two notations — Yourdon and Gane-Sarson, which differ in syntax. Online Store DFD example illustrates the Data Flow Diagram for online store, the interactions between Customers, Visitors, Sellers, depicts User databases and the flows of Website Information. ConceptDraw DIAGRAM enhanced with Data Flow Diagrams solution lets you to draw clear and simple example of DFD for Online Store using special libraries of predesigned DFD symbols.
Entity Relationship Diagram Software Engineering
Entity Relationship Diagram (aka ER Diagram, E-R Diagram, ERD) is a time-tested and widespread software development and software engineering method for data modeling, illustrating the logical structure of databases and system design. For ERDs construction are used three basic elements: entities, attributes, and relationships. Chen's notation for ERD supposes the use of rectangles (boxes) to represent entities and diamonds to depict relationships between first-class objects. This notation is popular when creating conceptual data models of information systems. Another standardized notation for ER diagrams is Crow's foot notation. ConceptDraw DIAGRAM as a powerful Entity Relationship Diagram software engineering provides the tools of Entity-Relationship Diagram (ERD) solution from Software Development area of ConceptDraw Solution Park for instantly describing databases using ERDs of Crow’s Foot and Chen’s notations. Use the predesigned vector elements for both these notations from 2 libraries included to Entity-Relationship Diagram (ERD) solution.Design Element: Chen for Entity Relationship Diagram - ERD
Entity-Relationship Diagrams (ERDs) were developed and introduced as a convenient and visual tool for the data modeling, they are the perfect way for easy determining data and also relationships between them. The first standard notation for ERD was proposed by Chen. Chen's notation is very rich on the data modeling tools and standard notation symbols and elements for drawing easy understandable Entity-relationship diagrams, Attribute diagrams, Decomposition charts, which are especially popular for designing relational databases. The entity is the main term, it is a set of instances abstract or real objects with common characteristics or attributes. Any system's object is represented by one uniquely identified entity, relationships describe the links between the entities. ConceptDraw DIAGRAM diagramming software, which includes the Entity-Relationship Diagram (ERD) solution, offers all needed tools for professional drawing ER diagrams. Specially developed vector ERD design elements according to Chen and Crow's Foot notations are indispensible for professional ERDs design.Process and Instrumentation Diagram
If you need create a Process and Instrumentation Diagram, it is convenient to design it in ConceptDraw DIAGRAM software which offers powerful Chemical and Process Engineering Solution from the Industrial Engineering Area.Flow Chart Creator
ConceptDraw DIAGRAM is a flowchart design software. There are large collections of professional flowchart symbols for process flow diagrams, standard flowchart symbols and colored basic flowchart symbols. Built-in examples and video lessons allow users to get started immediately and do drawing of virtually any type of flowchart or process flow diagramsConceptDraw Arrows10 Technology
How should diagramming software work? The answer is - Fast and easy. "Tree"- mode drawing works like that. Just select objects in your drawing and press Tree or Chain button to connect all of them just in one click. Your diagram looks professional and it took only a moment to draw.
 Energy Industry Infographics
Energy Industry Infographics solution is ideal for designing energy-related business infographics, diagrams, charts, illustrations for documents and presentations. It provides a set of libraries with special vector energy industry symbols, icons for electrical power industry, nuclear power industry, fossil fuel industry, and renewable energy industry, energy icons of fuel gas, liquid fuel, solid fuel, industry icons of electrical substations, power plants. Collection of samples including nuclear fuel cycle and energy distribution schematics, electrical substation diagram, energy intelligence dashboard, electricity grid schematics, and many more is also included. This solution is indispensable for all engineers, chefs, managers, marketers, and other professionals working in energy industry.
 Manufacturing and Maintenance
Manufacturing and maintenance solution extends ConceptDraw DIAGRAM software with illustration samples, templates and vector stencils libraries with clip art of packaging systems, industrial vehicles, tools, resources and energy.
- Chemical and Process Engineering | Er Diagram For Petrol Pump ...
- Chemical and Process Engineering | Er Diagram Of Petrol Pump ...
- Workflow Diagram | Workflow Diagram Software | Process Flow ...
- UML Class Diagram Example for Transport System
- Drawing a Nature Scene | Draw Diagram Of Water Flow System
- UML Class Diagram Generalization Example UML Diagrams | UML ...
- Design elements - Pumps | Mechanical System Design Symbols
- Taxi Service Data Flow Diagram DFD Example | UML Class ...
- Mechanical Drawing Symbols | Design elements - Fluid power ...
- UML Class Diagram Notation | UML Diagram Types List | UML Use ...


